I just finished building the Stern acceptance rate prediction model. I will post the admissions calculator as soon as I have time to finish learning PHP and then build that portion of the website. I’ll probably have time to work on it over Christmas break, but right now I am too busy applying for interviews for summer internships. In the mean time I will share some of the insights I got from building the model.
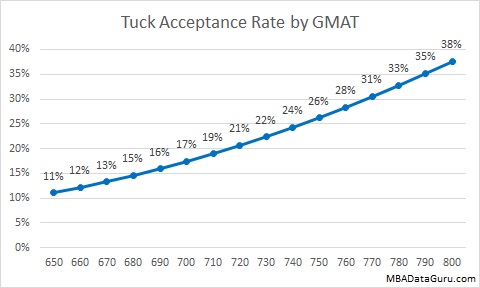
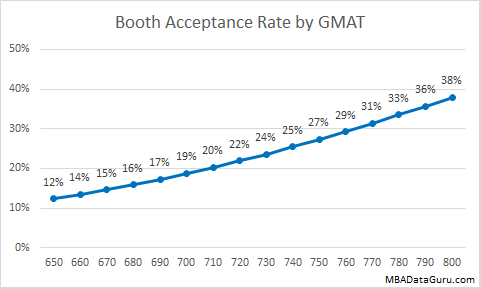
Stern Acceptance Rate by GMAT
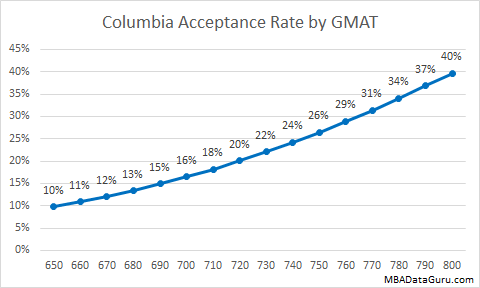
The first thing that jumped out at me was that the acceptance rates I came up with are noticeably higher than the published acceptance rate of 15%. I believe that this is because the average candidate who applies and posts their data on GMAT Club, where I get my data, is more competitive than the average candidate. The average GMAT Club applicant to Stern has a GPA or 3.45 and GMAT of 709, which is not too far from the scores listed on the class profile for Sterns class of 2016 of 3.52 and 721.
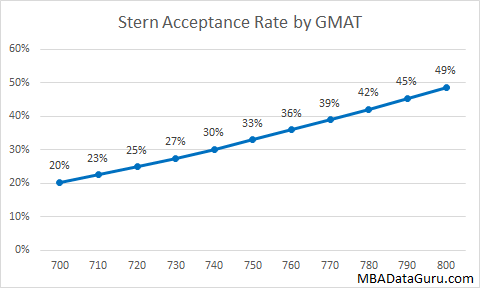 If you are applying to Stern, it is pretty obvious that having a higher GMAT is important and will significantly raise your chances of being admitted. To create the graph above, I used my model with the average GPA of 3.45.
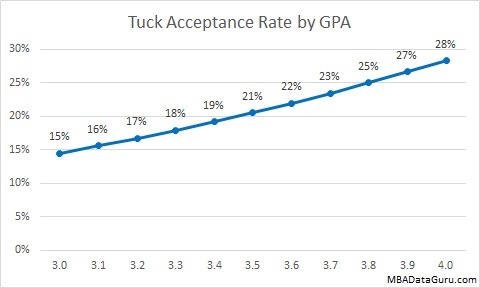
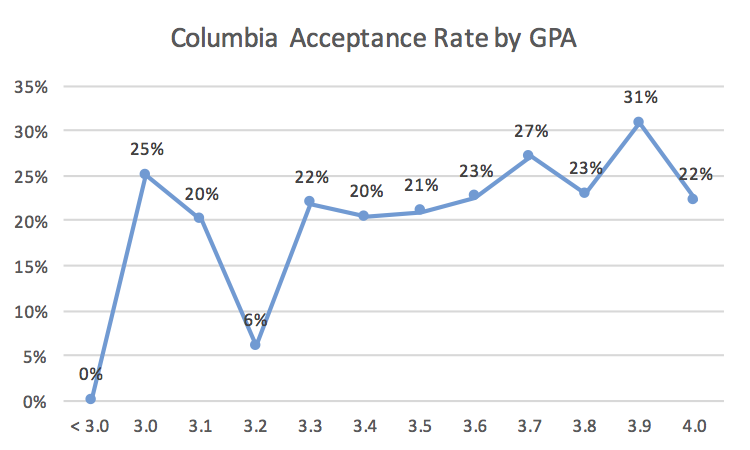
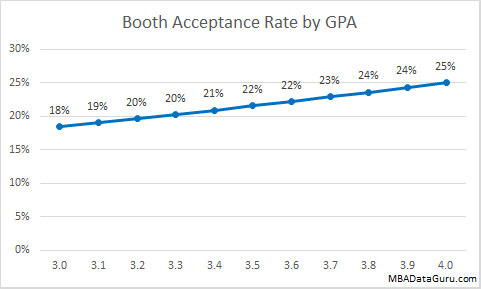
Stern Acceptance Rate by GPA
Next I looked at how GPA affects Stern acceptance rate. Once again there is a clear relationship between GPA and admission rate for NYU. In the graph below I used the average GPA score of 709 in my admissions model.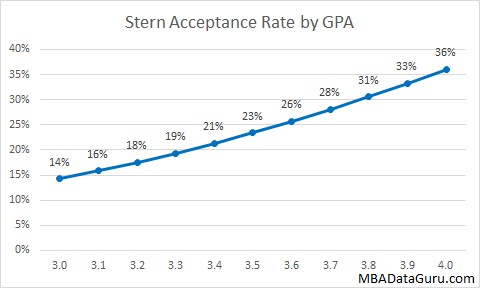
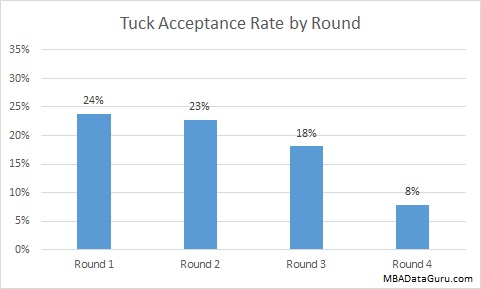
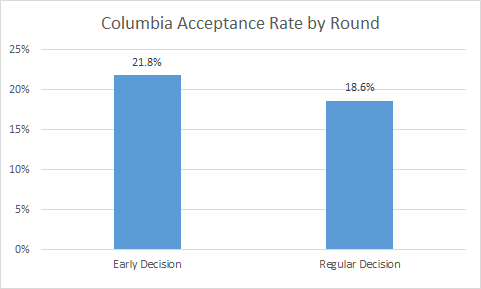
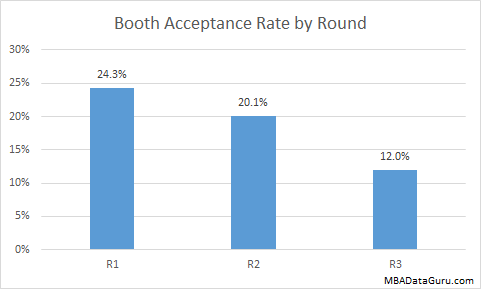
Stern Acceptance Rate by Round
Many candidates want to know if it matters in which round you apply. I took a look at the raw acceptance rate by round for NYU. As you can see the acceptance rate for round 2 is slightly lower and for round 3 it is noticeably lower.
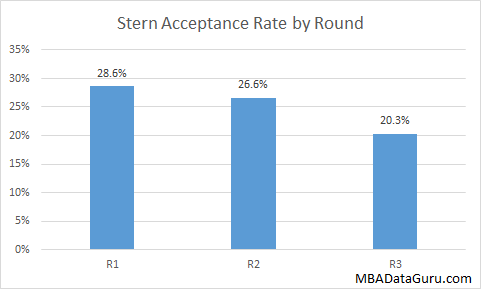 The acceptance rates above are raw numbers, not the predicted values from my admissions model. Why you ask? Because when I took into account all of the other factors, the round you apply in is not statistically significant. The reason the acceptance rate is lower in round 2 and 3 is not because the schools are more selective but because on average lower quality candidates apply in those rounds. If you are a qualified candidate, do not worry about applying to Stern in round 3, you still have a good chance of getting in.
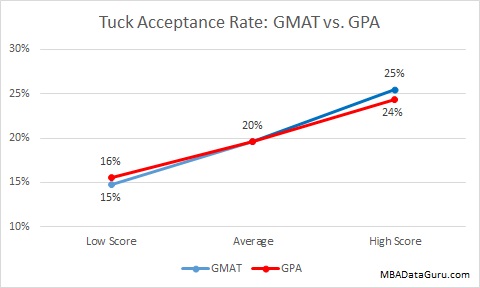
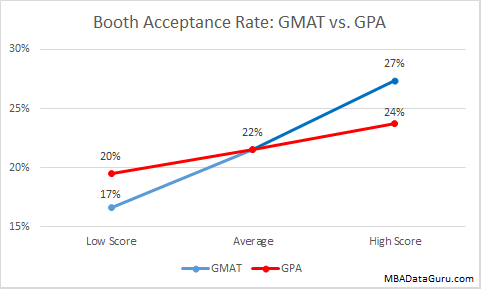
Stern Prefers GMAT over GPA
In the past I tried to figure out if Stern prefers a high GMAT or GPA and didn’t come up with anything conclusive. Now that I have built the Stern admissions model I can see how a similar change in GMAT or GPA impact acceptance rate at Stern. In the graph below I compare how much the admissions rate changes if I alter the GMAT or GPA by a standard deviation. If you are applying to business school then you should probably know what a standard deviation is, however if you don’t it is a standard measure of variance in a population or sample. Since I can’t compare an absolute variance because GMAT and GPA are on different scales, I compare how the shift of one standard deviation impacts the Stern acceptance rate.
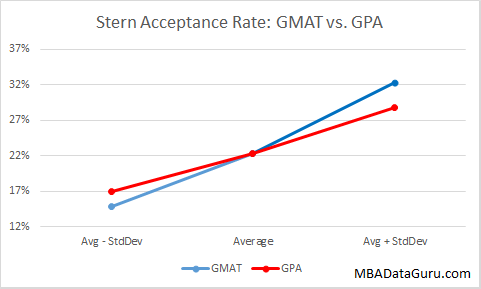 In the graph above, you can see that increasing the GPA by one standard deviation (.28) increase acceptance rate by 29%, but raising the GMAT score by one standard deviation (39) leads to a 45% higher chance of admissions. It is clear that Stern prefers candidates with high GMAT score over ones with a high GPA. This is good news for candidates with a low GPA because with enough hard work, you can increase your odds significantly by raising your GMAT.
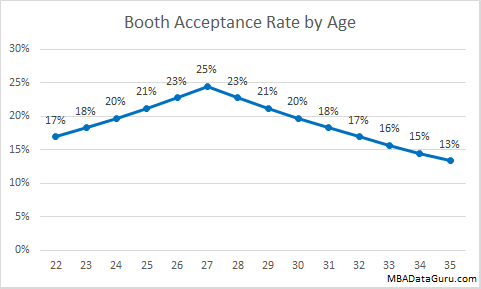
Other NYU Admissions Insights
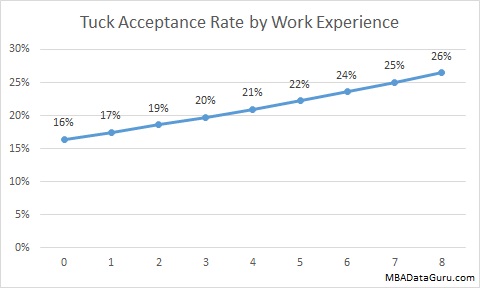
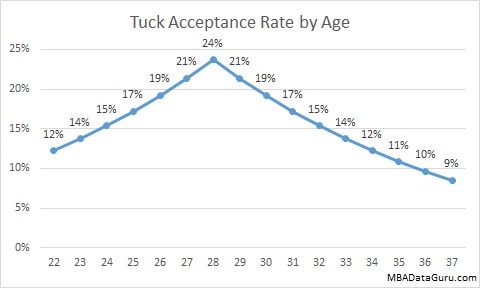
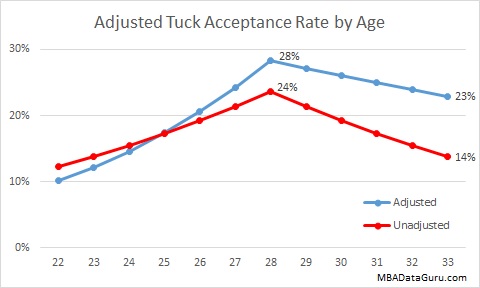
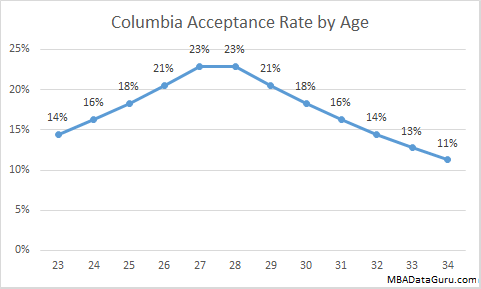
I also found that NYU prefers candidates with an average age of 27 to 28, the further you are from this average age, the lower your chance of getting in. Stern really likes candidates that come from consulting. Applicants from consulting had a acceptance rate of 42% vs. 21% for non-consultants. Having more work experience also increased your odds of admissions. Acceptance rate increased by about 2% for each year of work experience. However, once you pass 28, the age deviation factor is significantly stronger than the work experience factor so you shouldn’t wait until after 28 to apply.
I noticed that candidates that majored in business or engineering had a lower chance of admission. Business majors with average scores had a 8% chance of admission compared to 24% for non-business majors. Engineers had a 13% chance of getting in compared to a 26% chance for non-engineers. These differences are statistically significant even after taking into account all other factors. That being said, I majored in engineering and I got into Stern. I also know many other business and engineering majors who are currently attending Stern with me.
 Transitioning from the military to MBA is a fairly popular path to follow. A little over 4% of MBA applications come from military veterans. When looking at the data comparing military applicants to traditional MBA applicants, a few trends become clear: