I posted an updated Wharton acceptance rate analysis which is more accurate than this article. It shows how GPA and GMAT affect your odds of admissions.
Continuing the series on GMAT vs. GPA, here is the article on how much Wharton values the GMAT. Wharton is the 3rd ranked school according to US News and World Report.
Over the past year, both the director of MBA admissions Ankur Kumar and dean Dean Thomas S. Robertson have left Wharton. Many people have suggested that the quality of a Wharton MBA is declining due to dropping application numbers and prominent staff quitting. I personally think that Wharton is just as strong as it has ever been, and that it has just had an unlucky streak of staff quitting.
Some experts have suggested that because Wharton has seen a drop in applications and has had high level staff quit recently, Wharton will have a very conservative year for admissions and will focus on raising the measurable statistics such as GPA and GMAT. Lets see how recent events have shaped Wharton’s weighting for the GMAT.
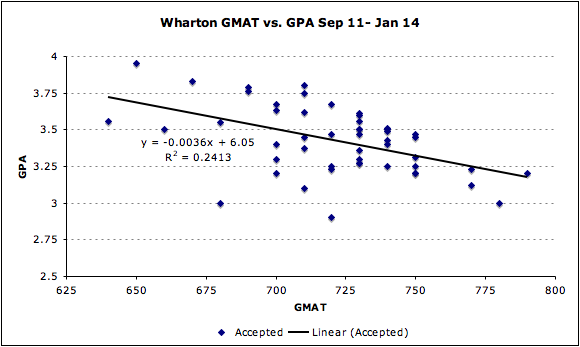
The first graph was created using the admissions data from the past three years. The slope is .0036 for accepts. This means that over the past 3 years Wharton values 10 GPAT points the same as it values .036 GPA points. An application with an 800 and 3.00 would be viewed similarly to a 700 and 3.36.
 The interesting question is how have recent events shaped Wharton’s admissions decisions. In the graph below you can see that slope of the accepted students has increased from .0036 to .0061, suggesting that this recruiting cycle Wharton has been weighting GMAT more heavily than GPA compared to previous years. The slope is now .0061, which means that 10 GMAT points are considered similarly to .061 GPA points. An application with an 800 and 3.00 would be viewed similarly to a 700 and 3.61.
 Although recent data suggests that Wharton has decided to weight GMAT as more important than GPA, this conclusion is premature. This recent data is very thin (it is based on only 14 accepts) and should not be considered completely accurate.
Methodology: The scatterplot represents the 50% of applicants who are accepted with the lowest GMAT and GPA. It isn’t helpful to look at the top 50% of applicants because those are not the marginal candidates who barely got in. I occasionally will remove very low outliers because those candidates may have been admitted due to very strong connections that most applicants don’t have. I never remove more than 5% of the total accepted students as outliers. The slope of the scatterplot demonstrates the point at which the school is indifferent to GMAT vs. GPA.
