An MBA applicant’s GMAT score impacts their acceptance rate at business schools such as Wharton. During the application process, GMAT is one of the few metrics that the applicant has any control over. Undergraduate GPA is already set in stone, work experience can’t be changed and recommendations are written by someone else. The only control a student has is their GMAT, resume and essays, so it isn’t surprising that applicants stress over their score. Today I am going to quantify exactly how much the GMAT impacts you chance of admission into Wharton.
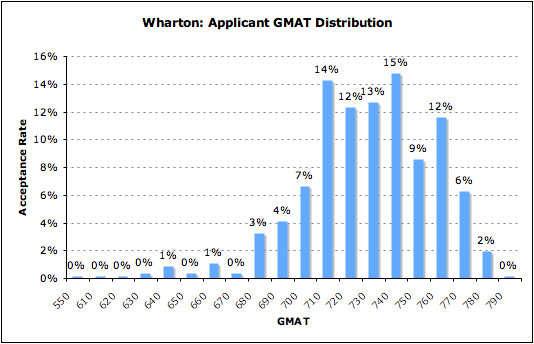
The first piece of information to look at is the distribution of GMAT scores for Wharton applicants. The graph below shows how many students who applied had each score. For the GMAT overall, students who receive a 760 or higher are in the 99th percentile, yet 20% of Wharton applicants have a 760 or higher. I think this data is somewhat skewed by the fact that it comes from the GMAT Club website, where I imagine applicants score higher on average. Surprisingly, the distribution is actually relatively flat between 710 and 760.
Wharton GMAT Distribution
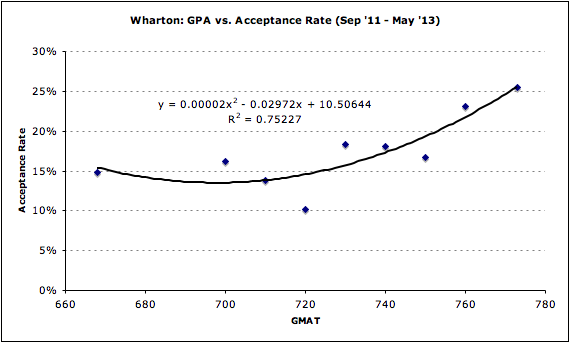
 Next I created a scatter plot of acceptance rate verses Wharton GMAT score. You can see that there is definitely a strong correlation between GMAT and chance of admission, with an R squared of 75%. Unexpectedly, the acceptance rate for applicants with scores below 700 was actually higher than the acceptance rate for applicants with a 710 or 720. Actually 720 had the lowest acceptance rate even though it is the average score for the Wharton class of 2015.
Wharton GMAT Acceptance Rate Scatter Plot
 I used a polynomial trend line for the scatter-plot because it had the highest R-squared. The polynomial actually creates a slight curve up at the low end for people with GMAT scores below 700. I don’t think this actually means that your chance of getting into Wharton is higher with a 690 vs. 720. I expect that this phenomenon is due to reporting bias for the GMAT Club data. Someone who gets into Wharton with a low GMAT score is more likely to report it than a person with a high score. I also think that someone with a low GMAT is less likely to even put their GMAT score in their profile because it is highly visible on the website.
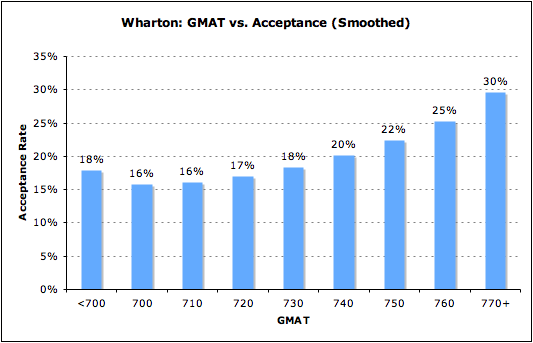
Wharton Acceptance Rate by GMAT
In the graph above, I smoothed out the acceptance rate by GMAT score and adjusted it up. In the GMAT Club data, not everyone updates their profile with the ultimate decision, so the acceptance rate needs to be adjusted up slightly. In the end GMAT score did not affect acceptance as much as I expected. However, probability of admissions is roughly twice as high for applicants with a 770 or higher compared to an applicant with a score of 700.
On a personal note, today I was invited by Wharton to interview for a spot in the class of 2016. I am extremely excited to be interviewed and will be concentrating on preparing for my interview over the next few weeks.
Update:
Acceptance Rate by Wharton GMAT
 This original analysis did not take into account several additional factors which impact acceptance, such as GPA, years of work experience and the industry the applicant worked in. The graph above is the result of a regression model I built that takes into account all of the other factors. Once GPA, country of origin, work experience are taken into account, the curve below 700 disappears. For more detail, check out the updated analysis of Wharton acceptance rate by GMAT and the disadvantage of applying from India.


I love that you love data. And since you do, I really hope that you end up at Wharton. Reach out to me if I can be of assistance in ANY way whatsoever.
I really think culling data from the GMATclub website is not useful. The sample size is not big enough to be indicative. And I think your somewhat wacky results prove that out. (Higher acceptance rate for 660 than 730 etc.) It’s a good idea and analysis just bad starting material. The big admissions consulting agencies seem to get a bigger sample size and have better predictors, it would be nice if you could get access to some of that data confidentially.
The data certainly isn’t perfect. This is an older analysis that I did without correcting for other factors like GPA, age, industry and country. When all those are taken into account, GMAT is a strong predictor of admission. You can check out a more up to date analysis on Wharton acceptance rate which is more accurate. https://www.mbadataguru.com/blog/admissions/wharton-acceptance-rate-indian-applicants/
Yeah, I just get a little confused about your data points. For example, 2% acceptance rate for 780. Where does that come from? You found 50 people with 780 that applied to Wharton and only 1 was accepted? This data was from GMATclub website? With 780 is ~99.9%ile, I find it hard to find 50 GMATclub members at all with that score. And as you can’t have 0.5 of a person admitted, to get a data point of 2% you would need at least 50 applicants.
I also think GMATclub is very bad because people use it and updated it a lot before getting admitted as they are worried and nervous with nothing to do but wait. But after getting admitted lots of people never even go back and log in again, as the website no longer has much utility for them.
The graph you are referring to is not acceptance rate graph but a distribution of GMATs for people who apply to Wharton. So roughly 2% of Wharton applicants have a 780 GPA.
Not everyone does end up updating after they find out their decision, but the data suggests that most people who are admitted do. If I assume everyone who doesn’t update was rejected, then the acceptance rate comes out pretty close to the acceptance rates published on other sites.