This page was first published on May 17, 2016. It was last updated July 7, 2026 by Data Guru.
For all of you soon to be MBA Students interested in consulting, McKinsey has a great opportunity for you. Apply for the McKinsey Emerging Scholars program by May 19th 2016. If you are selected to be a scholar, then you will receive a monetary award, mentorship from McKinsey consultants and an invitation to a celebratory event. In order to be eligible, you need to be a full-time MBA student that is starting in the Fall of 2016 from one of the following 16 schools:
University of California at Berkeley (Haas)
Kellogg, Northwestern
University of California at Los Angeles (Anderson)
University of Michigan, Ross School of Business
University of Chicago (Booth School of Business)
University of North Carolina in Chapel Hill, (K.F. Business School)
Columbia University (Graduate School of Business)
NYU, Stern School of Business
Cornell University (Johnson Graduate School of Management)
University of Pennsylvania (Wharton)
Dartmouth College (Tuck)
Stanford University (Graduate School of Business)
Duke University (Fuqua School of Business)
University of Virginia (Darden School of Business Admin)
This page was first published on December 31, 2015. It was last updated July 7, 2026 by Data Guru.
Many business school applicants wonder how many MBA applications they should submit? In this article, I will discuss the optimal MBA application number based on real data. Deciding on your MBA application number is challenging because the more schools you apply to, the less time you have to spend on each application. On the other hand, you don’t want to put all of your eggs into one or two baskets. The data suggests that the ideal number of MBA applications is 5 to 7. For more information, check out this article on how to build your portfolio of MBA applications co-authored by Lawrence Linker and I.
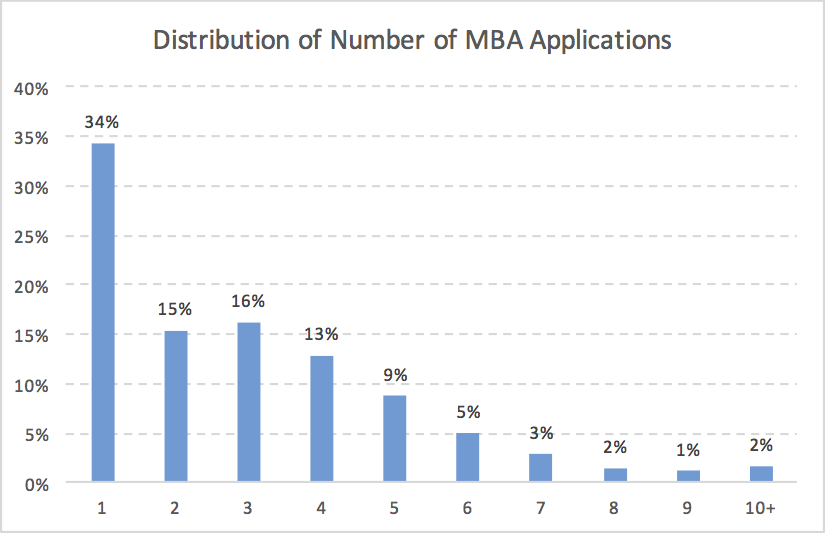
Distribution of Number of MBA Applications
For this analysis, I used MBA application data from GMAT Club forums, which is self reported admissions data. By matching usernames across different school applications, I was able to get the number of MBA applications submitted. It seems strange to see that a third of applicants only applied to one school. I would have expected more applicants to apply to 5 or more schools. Even if we assume the source is slightly biased and ignore those who apply to only one school, two thirds of the remaining applicants still apply to only 4 or fewer schools.
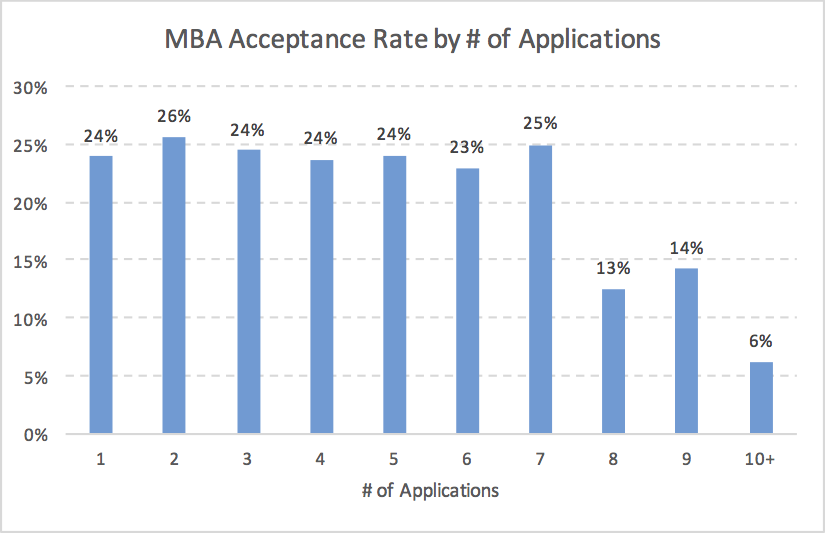
MBA Acceptance Rate by MBA Application Number
This graph is possibly the most important piece of information for applicants who are considering applying to a lot of schools. It shows that average acceptance rate per application is relatively flat if you apply to seven or fewer MBA programs, at around 24%. However, if you apply to more than seven schools then acceptance rate plummets to lower than 15%. Those few individuals who apply to 10 or more schools only have a meager 6% acceptance rate. Perhaps there are alternative explanation as to why these acceptance rates drop so much, such as GMAT or GPA of the applicants.
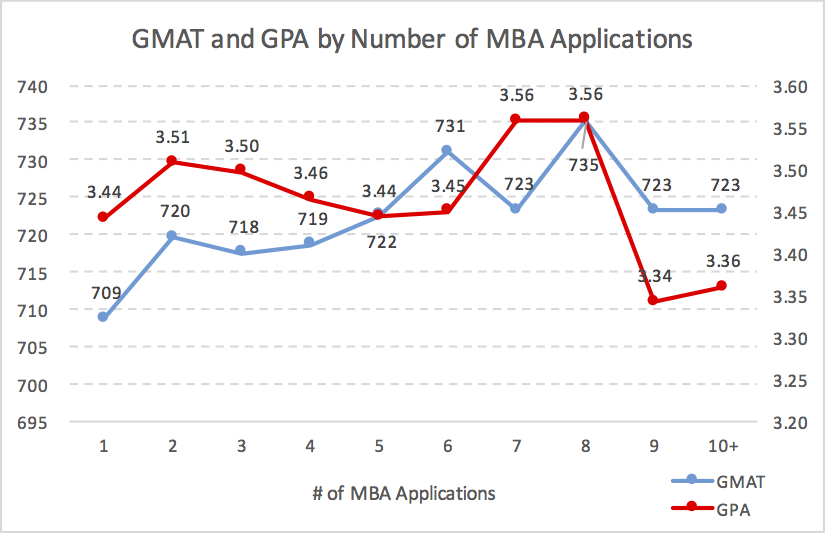
GMAT and GPA by Number of MBA Applications
Despite having the highest average GMAT and GPA, applicants who apply to 8 schools have an acceptance rate of only 13%. This supports the idea that if you apply to many schools then you don’t have as much time to commit to each application, so quality decreases. Those who apply to 9 or 10+ schools tend to have lower GPAs while those who apply to 1 school tend to have lower GMATs. People who apply to 6 to 8 schools on average have the highest combined scores.
Also applicants that don’t get in for round 1 often apply during round 2 or 3. I found that 63% of applicants who applied to 2 to 5 schools applied to all schools in the same round while only 25% of applicants who applied to 6+ schools applied to all schools in the same round. Surprisingly there wasn’t much of a difference in average acceptance rate for those who applied to all schools in one round vs multiple rounds except for 8+. When applicants applied to 8 or more schools in one round, the acceptance rate was 50% lower than applicants who applied to 8 or more schools but did it in multiple rounds. So if you plan to apply to many schools, spread it out over a few rounds.
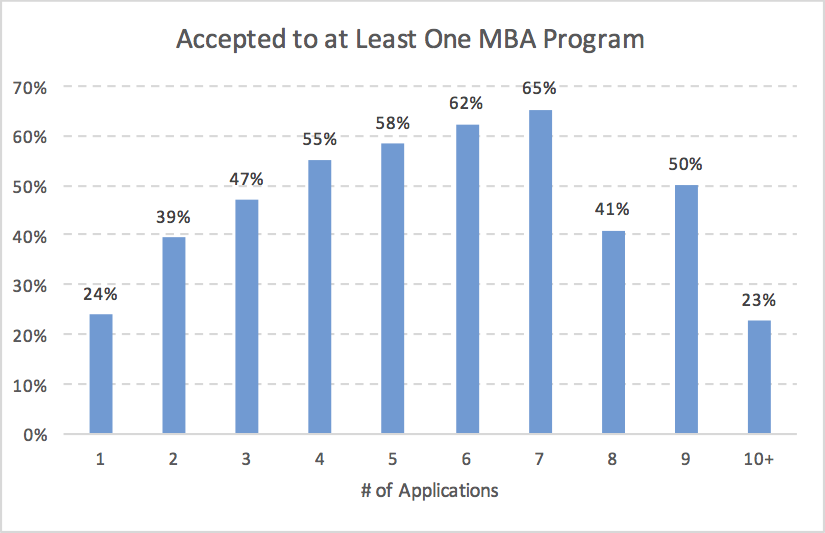
Accepted to at Least One School by MBA Application Number
The next question is how likely is an applicant to get into at least on MBA program? If you want at least a 50% chance of being admitted, you should apply to 4 or more schools. The peak is 65% for those applying to 7 schools. If acceptances were completely random with a 25% acceptance rate and 7 applications, we would expect 87% to get into at least one school. This gap suggests that the applicants who are accepted tend to get into many schools while 35% are rejected by everyone. Similarly, for those applying to 5 schools, we expect 75% to get at least one acceptance but only 58% are admitted. I expect that this is because there is a major flaw in their application and they repeat it with every school. This is one of the reasons I suggest applicants use an admission consultant for at least one school. Catch the mistake early with the first school and you will be in much better shape.
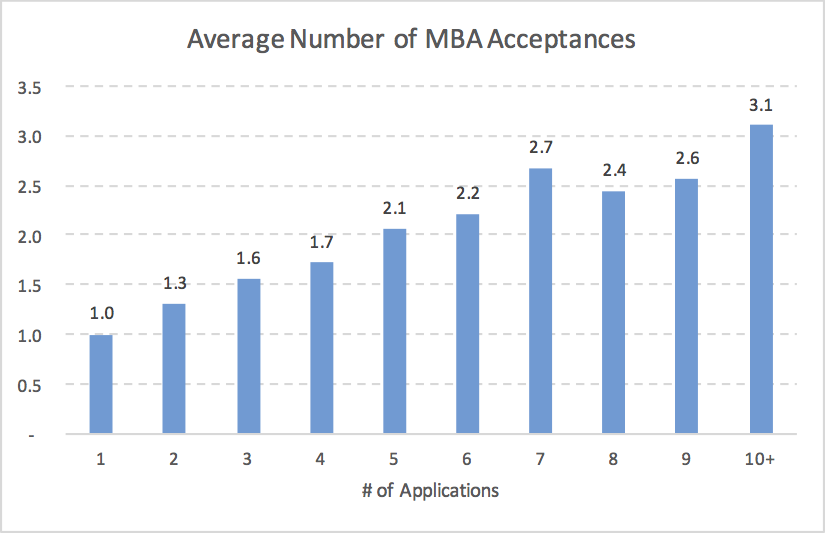
Average Number of MBA Acceptances
The graph above shows how many schools applicants got into, if they were accepted to at least one school. Unsurprisingly, those who applied to many schools were more likely to have a choice.
MBA Rank Comparison
The final graph shows the average school rank of the schools applied to verses the school to which they were admitted. I excluded applicants who did not get into at least one school. It is not shocking that applicants tended to get into lower ranked schools than the average rank of their applications. The big takeaway here is that the gap is much smaller for applicants that submitted 5 or fewer applications. For applicants with 2 to 5 applications, the average school accepted is 2 ranks worse than the average application. For applicants with 6+ applications, the average school accepted is 3.2 ranks worse than the average application. So applying to many schools degrades your chance of being accepted to the most elite MBA programs.
In conclusion, there are many considerations when deciding how many MBA applications to submit. Most of the data suggests that an applicant should apply to 5 to 7 schools to maximize their chance of getting into at least one school. If you want to raise your chance of being accepted to at least one MBA program above the 65% figure for 7 applications, I recommend you hire a consultant to help you craft your essays and avoid major mistakes rather than just submitting more applications.
This page was first published on December 8, 2015. It was last updated July 7, 2026 by Data Guru.
By
As Founder and Application Coordinator for , one of the first things I’m often consulted on is how many schools an applicant should apply to and which ones. This is an extremely important step to get right in the application process, because there is almost no other decision you will make along the way that has a greater influence on how likely it is you will end up getting into a school with which you will be happy.
When considering your application strategy, there are a few key considerations to take into account:
How much do you need to go to business school this year?
How wide is the prestige range of schools you are looking at? ie, do you want to get into Harvard, but would you be willing to go to Kenan-Flagler if accepted?
What is your personal level of risk tolerance?
From a qualitative point of view, I think most applicants well understand the implications of applying to many schools, but I reached out to my friend Wayne Atwell of MBADataGuru.com because I wanted people to see hard data on how different application strategies affect their chances of admission. My comments are in black, Wayne’s are in green.
In order to make this simulation as realistic as possible, I’ve asked Wayne to use data from his pool of applicants.
Thanks, Lawrence. I would like to introduce you to our sample MBA applicant, lets call him Robert. Robert is applying round one and has a 710 GMAT and a 3.5 GPA from his undergraduate university where he majored in engineering. He is 27 and has 5 years of work experience as a consultant. He is considering applying to Harvard, Wharton, Sloan, Tuck and McCombs. Here are his predicted chances if he were to apply to just one school.
Harvard
Wharton
Sloan
Tuck
McCombs
12%
13%
14%
31%
46%
Thanks, Wayne.
Unsurprisingly, Robert’s chances of getting into each program tracks well with their known selectivity. With statistics so low, it’s easy to be discouraged. While most applicants would like to believe that if they just hit a certain GMAT number, just talk to the right people, or just want it bad enough, they are sure to get in to the program of their dreams. The statistics do not bear this optimism out.
All is not lost, however. Let’s now look at the probability of a total failure (no admission to any school) by multiplying through the probability of failure for each school. Taking the reciprocal of that gives us the probability of success in getting into at least one of the schools for the applicant. Robert has a 75% chance of being admitted to one of his top schools which means his chance of total failure is only 25%. You have to admit it is a much better looking number.
Now, let’s say Robert really is determined to start business school next year and is still uncomfortable with the above number. He needs to increase his overall probability of getting into at least one school he will be happy to go to, but he also don’t want to completely eliminate the chances of going to his dream school, Harvard. Over to you, Wayne.
To give Robert a better chance of getting into at least one business school next year, we’re going to have him apply to some less selective programs. Here are the results.
Harvard
Cornell
UNC
Ross
McCombs
All 5 Schools
12%
47%
51%
51%
46%
94%
Thanks, Wayne. Obviously, Robert’s chances for HBS are unchanged. He has decided to swap out Sloan, Wharton and Tuck for Ross, Johnson, and Kenan-Flagler, less selective programs that offer many of the same benefits. Now when we look at the chance of total success, we see a very different figure.
Needless to say, if Robert gains admission to HBS, we expect he will have an easy decision. But it’s nice to know he is covered in case that doesn’t happen.
Now for our last example, let’s take a look at a different kind of applicant. This applicant has the same statistics as Robert, but they have a very different strategy in mind. For this applicant, it is a highly ranked school or nothing. They can live with not going to business school next year, but they are ready to go if they can get into an ultra-prestigious program.
Let’s take a look at this person’s application profile.
We’re going to have this applicant apply to only the most competitive programs. Find the statistics below.
Stanford
Harvard
Wharton
Sloan
Columbia
All 5 Schools
4%
12%
13%
14%
36%
59%
Taken individually, none of these chances are particularly encouraging, but put together, the success rate is actually not too bad! Considering this applicant is applying to only the most selective schools, this is a rate of success I would think any applicant should be happy with.
Here are a few additional things to keep in mind when thinking about which and how many schools you should apply to:
Applying to more schools will always give you a higher overall success rate statistically, but practically speaking there is a point of diminishing returns. A poorly executed application will always get a ding, no matter how strong your profile. In our experience, for most people, the magic number of schools to apply to is 5.
The above models don’t take fit into account at all. There are similarities between schools that an intelligent applicant can exploit by applying to schools with similar offerings, decreasing their need to come up with widely different rationale’s for why they want to go to each school. Put another way, actually think about what schools you want to go to, and apply to schools that are a genuine fit, rather than taking a purely random approach.
Applicants often have the belief that school selectivity is totally ordinal. That is to say, if you get denied by a less selective school, a more selective school will certainly deny you. That is absolutely not the case! We see this happen all the time. There is simply an element of luck or chance in the application that can NEVER be removed. But it can be mitigated! More on that soon!
The data used to predict acceptance rates for this post came from GMAT Club.
This page was first published on November 24, 2015. It was last updated July 7, 2026 by Data Guru.
Many applicants worry about applying to business school if they have a low GPA. I analyzed the low GPA MBA acceptance rate at the top 25 schools to see what are the realistic chances for applicants with a GPA below 3.0. In my data sample from GMAT Club, less than 3% of applicants had a low GPA, which I defined as below 3.0. Individual schools did not have enough data for me to analyze in depth, so I grouped schools into clusters for analysis. I was surprised to see that low GPA MBA acceptance rate is a lot higher than I expected.
Low GPA MBA Acceptance Rate by School Rank
For applicants who have a low GPA, school selection is extremely important. Only 8% of applicants with a GPA below 3.0 are accepted by top 10 schools. This is much lower than the 18% acceptance rate for applicants with a higher GPA. Acceptance rate is much closer at schools ranked 11 to 16 for low GPA applicants. Low GPA MBA acceptance rate is highest for schools ranked between 17 and 25 on US News’ top business school rankings. There is only a small disadvantage for low GPA applicants who apply to schools ranked 17 to 25. Next I looked at how GMAT impacted chance of admission for low GPA applicants.
Low GPA MBA Acceptance Rate by GMAT and School Rank
As you can see in the graph above, GMAT is especially important for applicants with a low GPA. An applicant applying to a top 10 school with a GMAT below 700 has an extremely low chance of being admitted. Scoring a 750 or higher raises an applicants acceptance rate to 13% at top 10 schools. However, an applicant is much better off just applying to lower ranked schools. Low GPA applicants with a GMAT below 700 had a respectable 20% acceptance rate at schools ranked 11 to 16. An applicant with a GMAT of 750 or higher has double the chance of admission, with acceptance rate of over 40%. For MBA programs ranked 17 to 25, it seems that applicants with a GPA below 3.0 only need to score 700 or higher to have a 50% chance of admission.
Although there is not enough data to analyze low GPA acceptance rate in depth at each school. I posted the acceptance rate for each school below. I included the sample size of so you can get an idea of how trustworthy the acceptance rate calculations are. For example, Foster and Mendoza have a sample size below 10, so you probably can’t trust the accuracy of these acceptance rates. On the other hand, Ross has a sample size of 45, so I trust the 40% acceptance rate for Michigan much more than Mendoza and Foster.
MBA Acceptance Rate for Applicants with GPA Below 3.0
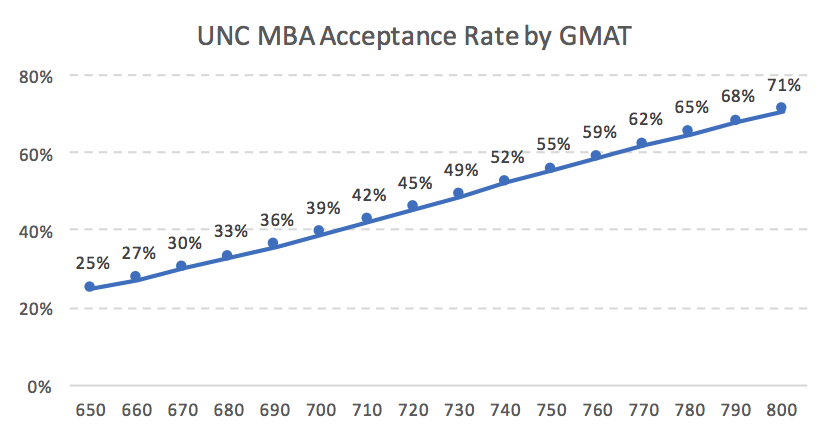
GMAT has a very high impact on acceptance rate at UNC. Increasing your GMAT by just 50 points from 650 to 700 increases your chance of being accepted by 56%.
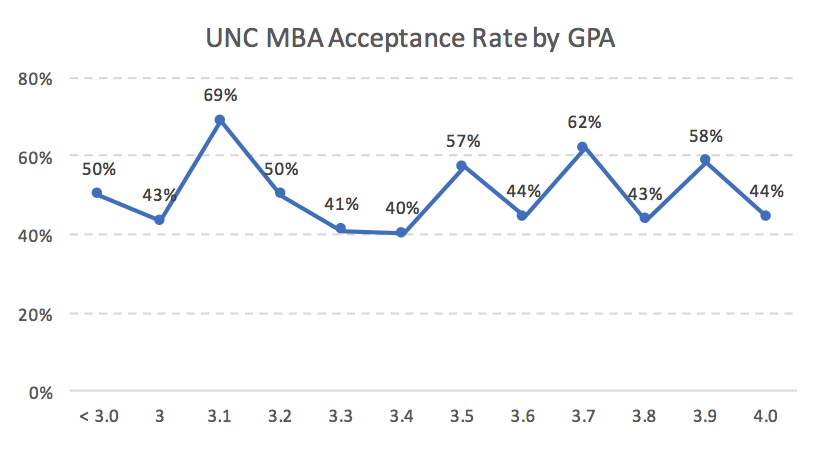
UNC MBA Acceptance Rate by GPA
Undergraduate GPA has little to no impact on UNC MBA acceptance rate. Surprisingly, applicants with a 4.0 actually had a lower acceptance rate than those with a GPA below 3.0. Applicants with a low GPA should certainly consider applying to Kenan-Flagler.
Applicants that majored in science, math and computer science tended to have high acceptance rates. On the other hand applicants who worked in computer software tended to have a lower acceptance rate. Indian citizens have a much lower chance of admission. US applicants have a 50% acceptance rate, but Indian applicants have an 18% chance of getting admitted.
This page was first published on November 4, 2015. It was last updated July 7, 2026 by Data Guru.
The interview is a crucial component of the MBA admission process. All top full-time MBA programs interview applicants before admitting them. Generally the MBA admissions committee is looking for two things during the interview, that you fit the culture of the school and that you have the emotional intelligence to succeed at business school. I have already looked at MBA Interview acceptance rate by itself. However, I always wondered when applying to business school if all applicants are considered equal after they have been invited to interview or does the rest of the application, like the GMAT and GPA, still matter. It turns out that it matters at some schools and not at others.
MBA Interview Acceptance Rate: High vs. Low GMAT
The graph above shows the average acceptance rate for applicants who were invited to interview, separated into GMAT below 720 and GMAT 720 and higher. Two thirds of the schools have a higher acceptance rate for applicants with high GMATs. This suggests that being invited to interview does not put everyone on an even playing field, other components of the application still matter. Booth, UNC, Stanford and Columbia have the largest disadvantage for applicants with low GMAT during interviews. At the other end of the spectrum, MIT, Tepper, Emory and McCombs all have a higher acceptance rate for applicants who were invited to interview but have a lower GMAT score. I don’t think that a lower GMAT actually helped these candidates, but that these schools consider the interview to be more important than other schools, which gives low GMAT applicants the opportunity to stand out.
MBA Interview Acceptance Rate: High vs. Low GPA
Unlike GMAT, half the schools seem to care about GPA after interviewing candidates while the other half do not. Similar to the GMAT table, MIT, Tepper and McCombs have a higher acceptance rate for applicants with lower GPAs. The only exception is Emory, which still doesn’t have that much of a disadvantage for low GPA. GPA does not seem to be as important as GMAT to admissions committees after interviews given that the average disadvantage for low GMAT is -10% and the average disadvantage for low GPA is -1%.
Most of the schools cut applicants with low GPA and low GMAT before interviews. I excluded Tuck and Kellogg because they will interview all applicants who want to interview. So it is not fair to compare them to the other schools who have already cut applicants with low scores. I included their tables at the end of this article for reference.
My take away from this analysis is that some schools place a lower weight on interviews while other schools place a higher weight on interviews. If you are applying to Booth with a high GMAT and GPA then you probably don’t need to stress the interview too much. On the other hand if you have a low GPA and GMAT and are applying to Sloan, you should prepare as much as possible for your MIT MBA interview because they take their interviews much more seriously than other schools.
This page was first published on September 16, 2015. It was last updated July 7, 2026 by Data Guru.
When I first built the Stanford MBA acceptance rate model, it showed that GPA had little to no impact on acceptance rate. I have reevaluated the data and now I believe that GPA does matter when applying to Stanford. Although GPA has an impact on acceptance, GMAT is still more important for Stanford MBA admissions.
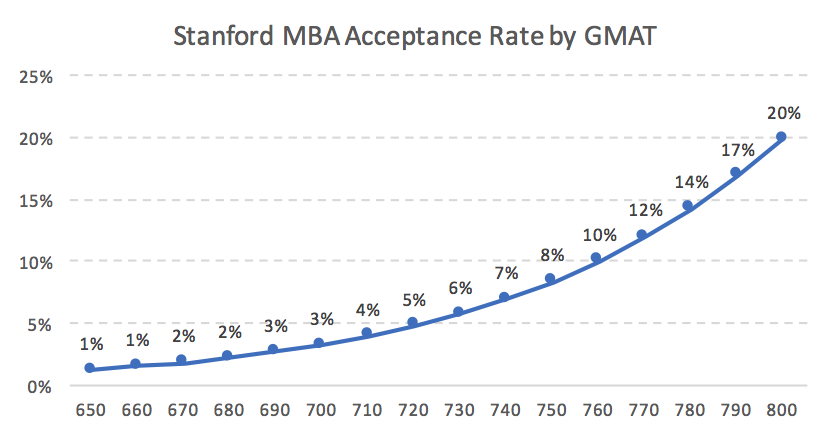
Stanford MBA Acceptance Rate by GMAT
GMAT is very important when applying to Stanford’s business school. When an applicant increases their GMAT by 100 points, from 650 to 750, they increase their chance of admission 8 fold. Average GMAT is over 730 points, which means an applicant must have a GMAT north of 750 for an acceptance rate in the double digits.
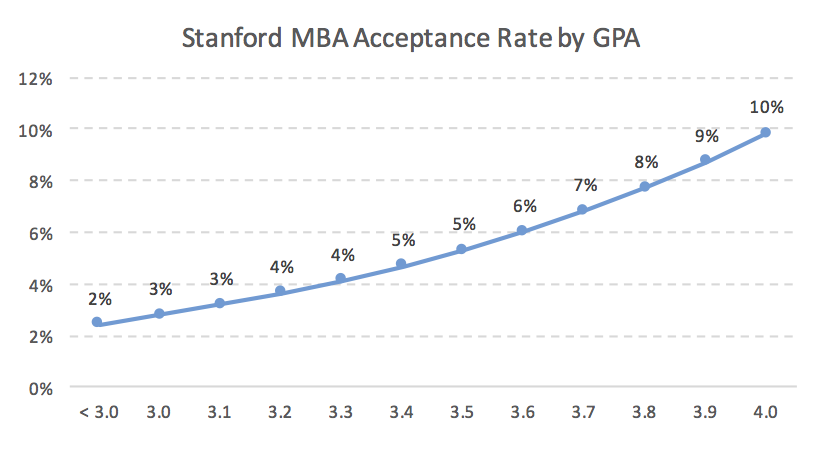
Stanford MBA Acceptance Rate by GPA
My new analysis demonstrates that GPA is actually important when applying to Stanford GSB. The average GPA of a Stanford applicant is 3.56. Each “.10” increase in GPA raises acceptance rate at Stanford by approximately 1%.
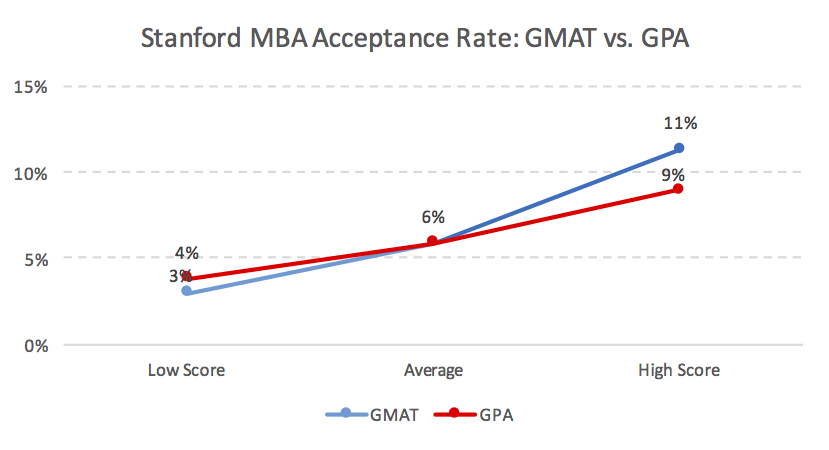
Stanford MBA Acceptance Rate GMAT vs. GPA
Although both GMAT and GPA are important factors that influence an applicant’s chance of admission to Stanford Graduate School of Business, GMAT is more important than GPA. A high GMAT increases acceptance rate at Stanford by 5%*. On the other hand, a high GPA only increase acceptance rate by 3%.
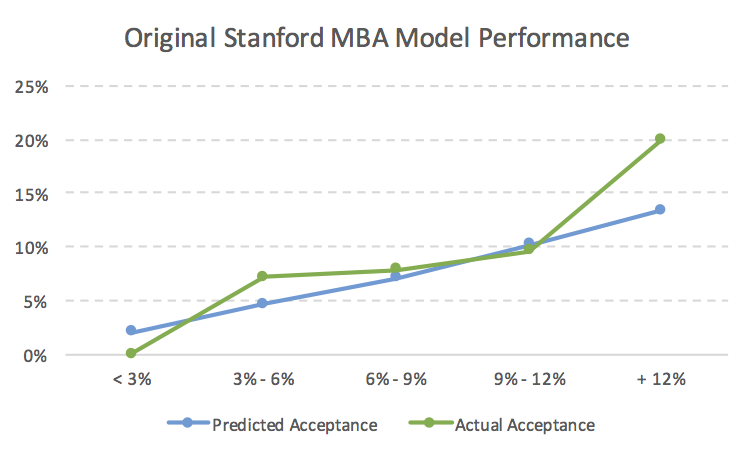
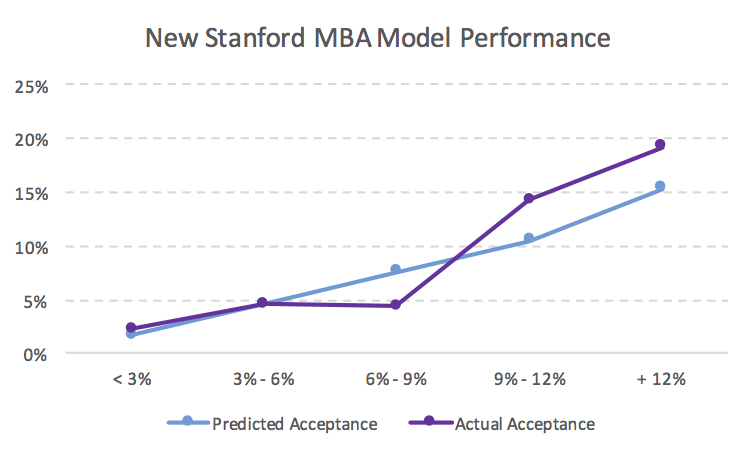
I was not happy with the original predictive model I built for Stanford. I updated my methodology for building the model, mainly in the way I cleaned the data. The results above represent my new model. Below I compare the performance of the old and new model. In order to evaluate performance, I grouped applicants into buckets based on their predicted acceptance rate, then looked at the actual acceptance rate was for that group. The X-axis is the predicted acceptance grouping and the Y-axis is the actual acceptance rate.
Original Stanford MBA Model Performance
Although the graph above looks like it does a good job of predicting the acceptance rate at Stanford. The results are deceptive because almost all of the population fall into the 3% – 6% or 6% – 9% groups, which have little separation.
New Stanford MBA Model Performance
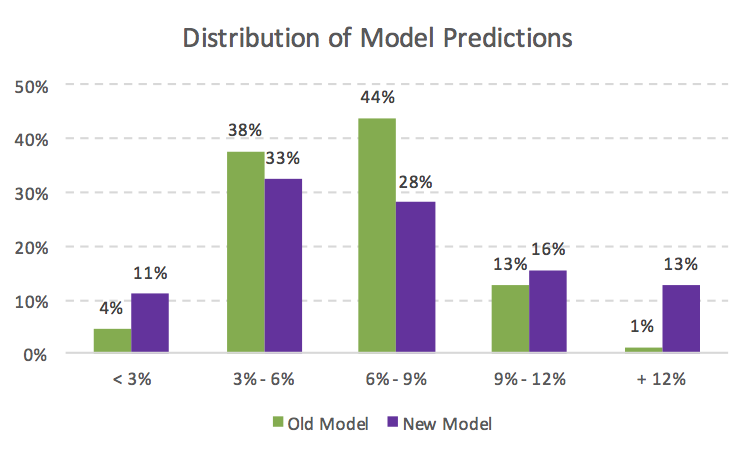
The new model clearly shows significant differentiation, with the exception of the 6% – 9% group. The biggest problem is that the 6% – 9% group has an acceptance rate that is over estimated and the above 9% population is under estimated. The main difference between the original model and new model is the distribution of predictions seen below.
Stanford MBA Model Distribution: New vs. Old
In the original model, 82% of all applicants fell into the 3% to 9% range with only 5% of applicants below 3% or above 12%. The new model has a much more even distribution of applicants. The number of low and high acceptance rate applicants has increased from 5% to 24%.
Data used to create this post came from GMAT Club, which is one of the best websites for preparing for the GMAT.
*A high GMAT or high GPA is defined as one standard deviation above average. A low score is defined as one standard deviation below.
This page was first published on August 27, 2015. It was last updated July 7, 2026 by Data Guru.
International MBA applicants are not competing on equal footing U.S. business schools love to emphasize international diversity. Class profiles proudly count the number of countries represented, and admissions offices routinely describe global perspective as one of the defining strengths of the MBA experience.
But international applicants are not all competing in the same admissions market.
Using self-reported decision data from 55 U.S. full-time MBA programs, I analyzed acceptance rates by country and by region, then adjusted those results for school mix. That adjustment matters because different applicant pools do not apply to the same schools in the same proportions. Some groups apply much more heavily to the most selective programs. Others apply across a broader or less selective range. If you ignore that, raw acceptance rates can tell a misleading story.
The dataset covers application years 2012 through 2025, excluding 2026 because of under-reporting. In total, the sample includes 32,059 final admissions decisions from 121 countries. Across the full sample, the overall acceptance rate is 55.0%.
One thing worth seeing up front is how the reporting base changes over time. The later years show fewer self-reported decisions and lower observed acceptance rates, which may reflect a drop in reporting behavior as much as a true deterioration in admissions odds.
Yearly Acceptance Rates
Application Year
Acceptance Rate
2012
54.8%
2013
51.1%
2014
53.8%
2015
52.9%
2016
53.9%
2017
56.3%
2018
59.2%
2019
64.4%
2020
67.8%
2021
61.6%
2022
49.0%
2023
48.3%
2024
36.2%
2025
25.6%
Application years 2012 through 2025. 2026 excluded because of under-reporting.
At the raw level, the disparities are already substantial. U.S. applicants posted a 58.5% acceptance rate. India, the largest non-U.S. pool in the data by a wide margin, came in at 48.0%. China was at 49.4%. Brazil was at 48.7%. Canada was at 52.3%. The United Kingdom was at 52.8%. Vietnam stood out at 73.3%, while Peru came in at 66.4% and Chile at 59.8%.
But raw rates blend together two different realities: admissions performance and application strategy.
To separate those effects, I calculated a school-mix baseline for each country. In practice, that means estimating the admit rate a country would be expected to have based only on the schools and years its applicants targeted. I then compared each country’s actual outcomes with that baseline. The result is a cleaner measure of relative performance that is less distorted by portfolio choice.
Once that adjustment is made, some of the rankings change a lot.
The United Kingdom is one of the clearest examples. British applicants had a raw acceptance rate of 52.8%, which looks close to average. But after adjusting for school mix, that rate rises to 69.3%. In other words, UK applicants in this sample appear to have applied to a significantly more selective set of programs than the average applicant, and their raw admit rate understates how strong their outcomes were relative to that portfolio.
A similar pattern shows up elsewhere. Chile rises from 59.8% raw to 70.2% adjusted. Peru moves from 66.4% to 70.1%. Australia climbs from 54.7% to 67.5%. Japan rises from 57.7% to 63.8%. Spain goes from 52.0% to 63.6%, and Germany from 54.0% to 61.4%.
The opposite pattern is most visible in South Asia, especially India. Indian applicants account for 7,338 final decisions in the sample, making India by far the largest international pool in the dataset. Their raw acceptance rate is 48.0%, already below the global average. But once school mix is held constant, their adjusted rate drops further to 43.0%. That is the weakest adjusted outcome among major countries in the sample.
This distinction matters. It would be easy to explain India’s lower acceptance rate simply by saying Indian candidates apply more aggressively to top schools. The data does support that claim: India’s school-mix baseline is 61.4%, far above its actual raw result. But adjustment shows that school choice is not the entire explanation. Even relative to the schools Indian applicants actually targeted, their admissions outcomes were weaker than the overall sample would predict.
Country Results
Country
Raw Acceptance Rate
School-Mix Baseline
Adjusted Acceptance Rate
United States
58.5%
53.8%
59.8%
India
48.0%
61.4%
43.0%
Brazil
48.7%
47.9%
55.9%
Canada
52.3%
52.9%
54.4%
China
49.4%
54.4%
50.0%
Singapore
47.5%
50.3%
52.0%
United Kingdom
52.8%
41.9%
69.3%
South Korea
50.9%
50.6%
55.4%
Mexico
51.8%
50.5%
56.5%
Vietnam
73.3%
65.4%
61.7%
Nigeria
59.2%
54.7%
59.5%
Chile
59.8%
46.9%
70.2%
Thailand
66.3%
59.6%
61.3%
Pakistan
53.3%
63.1%
46.4%
Indonesia
59.8%
58.7%
56.0%
Russia
44.9%
45.4%
54.3%
Japan
57.7%
49.8%
63.8%
Taiwan
50.7%
56.9%
49.0%
Hong Kong
52.3%
52.2%
55.2%
Germany
54.0%
48.4%
61.4%
Spain
52.0%
45.0%
63.6%
Peru
66.4%
52.1%
70.1%
Australia
54.7%
44.6%
67.5%
Bangladesh
43.1%
54.4%
43.6%
United Arab Emirates
58.8%
58.0%
55.8%
Turkey
56.3%
50.7%
61.1%
Countries with at least 100 final decisions. “School-mix baseline” is the admit rate implied by the schools and years that country’s applicants targeted. “Adjusted acceptance rate” holds that mix constant.
At the regional level, the same pattern holds. South Asia is clearly the weakest major region after adjustment, with a 43.1% adjusted acceptance rate. Latin America and the Caribbean looks materially stronger once school mix is held constant, rising to 61.9%. Europe and Central Asia also improves sharply, from 50.5% raw to 60.5% adjusted. Sub-Saharan Africa performs well too, though on a smaller base.
East Asia is more mixed. The region’s raw and adjusted rates are relatively close, which suggests that school mix is less of a distortion there than it is for Europe or South Asia. Southeast Asia remains solid overall, though some of its strongest-looking raw outcomes narrow after adjustment.
Regional Results
Region
Raw Acceptance Rate
School-Mix Baseline
Adjusted Acceptance Rate
North America
58.2%
53.8%
59.6%
South Asia
48.0%
61.3%
43.1%
Latin America & Caribbean
54.6%
48.5%
61.9%
Europe & Central Asia
50.5%
45.9%
60.5%
East Asia
51.3%
53.0%
53.2%
Southeast Asia
58.7%
56.3%
57.4%
Middle East & North Africa
55.2%
52.1%
58.4%
Sub-Saharan Africa
59.0%
52.0%
62.5%
Oceania
54.3%
44.9%
66.5%
The broader takeaway is straightforward: international diversity may be a priority for U.S. MBA programs, but international applicants are not entering a uniform competition. Country-level outcomes differ substantially, and some of those differences remain even after controlling for the selectivity of the schools applicants chose.
That means raw acceptance rates are only the starting point. Once school mix is taken into account, Europe and Latin America look stronger than they first appear, while South Asia, led by India, looks weaker. In other words, where an applicant comes from still matters quite a bit in U.S. MBA admissions, and the gap is not just about where people apply.
This page was first published on August 26, 2015. It was last updated July 7, 2026 by Data Guru.
McCombs School of Business is a top MBA program and part of University of Texas Austin. The full-time program is small; the class of 2017 is 267 students. McCombs average GMAT is 694 and average GPA 3.40. The acceptance rate is at the higher end of the spectrum at 35%. UT Austin also has an evening business school with more relaxed admissions criteria. For the evening MBA, GMAT is 640 and GPA is 3.34.
McCombs MBA Acceptance Rate by GMAT
GMAT has a strong impact on acceptance rate at McCombs. If you raise your GMAT by 100 points, from 650 to 750, your chance of admission increases by 120%. Even with a relatively low GMAT of 650, an applicant still has a respectable 1 in 4 chance of admission.
McCombs MBA Acceptance Rate by GPA
Although GMAT is critical when applying to University of Texas Austin, GPA does not appear to be important as long as it is above 3.0. When I built the acceptance model for McCombs, GPA was one of the first variable eliminated. As you can see in the graph above, GPA seems to have no impact on acceptance rate. Data is sparse below 3.0, so I cannot be confident how low an applicants GPA can be before it hurts them. However, if you have a low GPA and want to go to a top 20 MBA program, then McCombs is a great place for you to apply.
McCombs MBA Acceptance Rate by Application Round
When applying to McCombs, the round you apply during matters. Round 2 acceptance rate is not statistically different than round 1, but there is a penalty for applying round 3. Round 3 applicants are 25% less likely to by admitted than applicants from the first two rounds.
Other Factors that Impact McCombs MBA Acceptance Rate
Although a quarter of applicants studied engineering for their undergraduate degree, McCombs does not seem to love engineers. The acceptance rate for engineers is two thirds that of non-engineers. On the other hand, McCombs loves economics majors. Applicants who majored in economics are 70% more likely to be accepted to McCombs than other majors.
Data for this article was collected from GMAT Club, one of the best websites for preparing for the GMAT.
This page was first published on August 21, 2015. It was last updated July 7, 2026 by Data Guru.
Kellogg is somewhat unique in that it allows anyone who applies to interview. Kellogg MBA interviews are typically off-campus with an alumnus, although it is also possible to interview with an admissions committee member on campus or over Skype. Interviews with Kellogg tend to vary greatly based on who interviews you. You can expect anywhere from 6 to 14 Kellogg interview questions. Kellogg interviews are on the longer side, sometimes lasting an hour to an hour and a half. If you are interviewed by an alumni, typically they will have already read your resume but not your whole application. Below are the most common Kellogg interview questions, ranked from most to least common. Your chance of being asked each questions is in parenthesis.
Most Common Kellogg Interview Questions
Why Kellogg? (87%)
Why get an MBA? Why now? (87%)
What is your greatest accomplishment or what is the accomplishment you are most proud of? Sometimes when this question is asked, you are limited to an accomplishment at a certain company you worked at. (67%)
Walk me through your resume. (60%)
What will you contribute to the program? What will you get involved with at Kellogg? (60%)
Tell me about a time you faced a challenge. Frequently the interviewer asks specifically about a challenge or failure in a team environment. (53%)
What is your leadership style? (53%)
Tell me about your education. Why did you choose your major? (40%)
Is there anything else you would like me to know? (40%)
Why did you pick your company or industry? (27%)
What are your hobbies outside of work? (27%)
How would your coworkers or peers describe your strengths and weaknesses? (20%)
What role do you take within a team? (13%)
What inspires you? (13%)
What words would your classmates use to describe you? (13%)
Tell me about a time you took an initiative. (13%)
What are your long term goals? (13%)
You may also be asked specific questions about your resume or experiences. At the end you will have time to ask a few questions. For additional interview tips check out my MBA interview preparation guide. The questions for this article were collected from Clear Admit.