Tag Archives: Industry

Ross Acceptance Rate Analysis

I plan to post the Ross admission calculator online as soon as I have time to build that portion of the website, probably over Christmas break. In the mean time I will share some of the insights I got from building the predictive model.

Ross Acceptance Rate by GMAT

Obviously your chance of admission to Ross School of Business increases if you score higher on the GMAT. The good news is that Ross’s acceptance rate of 34% is significantly higher than almost all other business schools in the top 20. The Ross class of 2016 profile shows that the average GMAT and GPA are 702 and 3.4 respectively. The data used to create this analysis comes from GMAT Club. Of the applicants in my data set, 84% had GMAT of 700 or higher, which means that I am fairly confident about the relationship between GMAT and admissions in the 700’s but not as confident in the 600’s.

Ross Acceptance Rate by GMAT MBA Admissions Michigan School of Business 
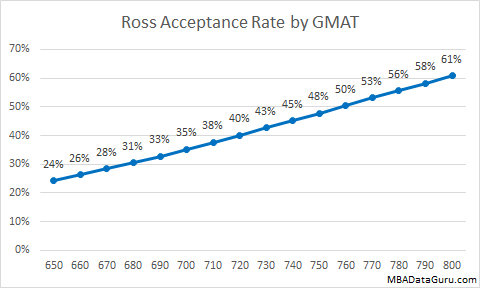
To create the graph above, I used the average GPA from my data set which is 3.42 and then shifted the GMAT score in my model. The model takes into account the interaction of GMAT, GPA, years of work experience, undergraduate major and the industry you worked in.

Ross Acceptance Rate by GPA

Next I looked at how GPA affects Ross acceptance rate. I’m sure it is not a surprised to hear that a higher GPA increases your chance of admissions at Michigan school of business. Ross Acceptance Rate by GPA MBA Admissions Michigan School of Business

Ross Acceptance Rate: GMAT vs. GPA

The real question is which is more important for raising your Ross acceptance rate, GPA or GMAT? In the graph below I compare how much the admissions rate changes if I alter the GMAT or GPA by a standard deviation. A standard deviation is a measure of variance in a population or sample. Since I can’t compare the absolute variance because GMAT and GPA are on different scales, I compare how the shift of one standard deviation impacts the Ross MBA acceptance rate.

Ross Acceptance Rate GMAT vs. GPA Admision Michigan School of BusinessAs you can see the slope is steeper for the GMAT line. This means that Ross prefers applicants with a high GMAT over applicants with a high GPA. One standard deviation higher in GMAT increases acceptance rate by 22% while a standard deviation in GPA only increases chances of admission by 14%.

Other Ross Acceptance Rate Insights

similar to Harvard and Wharton, at Michigan the acceptance rate is noticeably lower for Indian applicants vs. non-Indian applicants, 17% vs. 41% respectively. Engineering majors have a lower chance of admission while liberal arts majors have a higher chance. Many schools are trying to increase the number of women in their program. The higher acceptance rate for liberal arts majors may reflect Ross trying to attract more women, however my data set is missing gender information. More years of work experience increases the chance of admission by around 2.5% per year. Also military applicants have a higher chance of admissions.

For those of you who have already been invited to interview at Ross, your acceptance rate is higher at around 62%. Check out my Ross Interview Acceptance Rate Analysis to see what your chance of getting admitted is.

Good luck with your applications!

Harvard Business School Acceptance Rate Analysis

How can anyone ensure that they will be accepted to Harvard Business School? Unfortunately there are no assurances at the number one ranked business school which has an acceptance rate of 12%. This analysis will show you what factors impact Harvard Business school acceptance rate, such as GMAT and GPA.

Harvard Business School Acceptance Rate by GMAT

Similar to all other business schools, Harvard does care about your GMAT score. As you can see in the graph below, a higher GMAT results in a better chance of admission. If you want a double digit chance of admission you had better score a 740 or higher. Even at 800 the HBS acceptance rate is surprisingly only predicted to be 16%.

Harvard Business School Acceptance Rate by GMAT MBA HBS Admissions

Harvard Business School Acceptance Rate by GPA

Next we look at how GPA affects Harvard Business School acceptance rate. Obviously a higher GPA results in a better chance of admission at HBS. Acceptance rate doesn’t break into the double digits until you hit 3.7. This reminds me of why I didn’t even bother applying to Harvard with my 3.33 GPA. Damn you engineering, why did you ruin my grades?Harvard Business School Acceptance Rate by GPA HBS MBA Admission

Harvard Business School Acceptance: GMAT vs. GPA

The real question is which is more important for raising your chance of admission to HBS, GPA or GMAT? In the graph below I compare how much the admissions rate changes if I alter the GMAT or GPA by one standard deviation. A standard deviation is a measure of variance in a population or sample. Since I can’t compare the absolute variance because GMAT and GPA are on different scales, I compare how the shift of one standard deviation impacts the Harvard MBA acceptance rate.

Harvard Business School Acceptance Rate GMAT vs GPA MBA HBS AdmissionsUnlike at Stern and Wharton, Harvard values GPA over GMAT. Harvard acceptance rate increases by 30% when GPA increases by one standard deviation but only by 25% when GMAT increases by a standard deviation. This indicates that GPA is more important than GMAT at HBS, and they are willing to roll the dice on a candidate with low GMAT like the guy who was accepted last year with a 550.

Other HBS Acceptance Rate Insights

The round you apply in does have an impact on your chance of being accepted at HBS. Applying in a later round significantly reduces your chance of admission at Harvard. The data for round 3 is not statistically significant due to low sample size, but I wouldn’t risk applying in round 3 unless you have a godly application. Perhaps after this recruiting year is over I’ll have enough data to confirm and update the model.

Harvard Acceptance Rate by Round HBS MBA AdmissionsIf you want to maximize your chances of getting into Harvard, then be sure to apply during round 1. Additional work experience does increase your odds of getting into Harvard by a small amount, roughly .5% per year. I’m sure a lot of peoples’ next question is what about the 2+2 program? I do know about the 2+2 program Harvard has but I can’t tell which candidates are applying through the 2+2 program vs. not. However I can tell you that of the 59 people in my sample who are 24 years old or younger , none were admitted. So although it is possible to get in if you are younger, it certainly is more challenging.

Next I’ll mention a few factors that are out of your control in the short term but should be known so you can plan accordingly. Similar to Wharton, applicants who are applying from India have a lower chance of admissions, only 1.5% of applicants from India are accepted. Applicants who majored in finance also have a significantly lower chance of being admitted, only 2%. And finally applicants who have worked in venture capital or the military have a much higher admissions rate, 16% and 17% respectively.

Update: I took a quick look if I could predict acceptance rate accurately for people who were already selected for an interview. They only factors that had any predictive power were round, age and major. Average acceptance rate is 49%, with older candidates doing a little better about 7% higher acceptance rate for someone a year older than average. Round 2 applicants had a 37% acceptance rate, while round one had a 57% chance. And finally, applicants who majored in finance had a 16% chance of admittance. In the end, it is very difficult to predict admissions for candidates once they have been invited to interview, which suggests that to Harvard the interview actually matters.

Good luck with your Harvard applications!

For undergrads, check out the Harvard acceptance rate analysis at College Admit Me.

Stern Acceptance Rate Analysis

I just finished building the Stern acceptance rate prediction model. I will post the admissions calculator as soon as I have time to finish learning PHP and then build that portion of the website. I’ll probably have time to work on it over Christmas break, but right now I am too busy applying for interviews for summer internships. In the mean time I will share some of the insights I got from building the model.

Stern Acceptance Rate by GMAT

The first thing that jumped out at me was that the acceptance rates I came up with are noticeably higher than the published acceptance rate of 15%. I believe that this is because the average candidate who applies and posts their data on GMAT Club, where I get my data, is more competitive than the average candidate. The average GMAT Club applicant to Stern has a GPA or 3.45 and GMAT of 709, which is not too far from the scores listed on the class profile for Sterns class of 2016 of 3.52 and 721.

Stern Acceptance Rate by GMAT MBA Admissions Business School NYUIf you are applying to Stern, it is pretty obvious that having a higher GMAT is important and will significantly raise your chances of being admitted. To create the graph above, I used my model with the average GPA of 3.45.

Stern Acceptance Rate by GPA

Next I looked at how GPA affects Stern acceptance rate. Once again there is a clear relationship between GPA and admission rate for NYU. In the graph below I used the average GPA score of 709 in my admissions model.Stern Acceptance Rate by GPA NYU Admissions Business School

Stern Acceptance Rate by Round

Many candidates want to know if it matters in which round you apply. I took a look at the raw acceptance rate by round for NYU. As you can see the acceptance rate for round 2 is slightly lower and for round 3 it is noticeably lower.

Stern Acceptance Rate by Round MBA NYU Admissions Business SchoolThe acceptance rates above are raw numbers, not the predicted values from my admissions model. Why you ask? Because when I took into account all of the other factors, the round you apply in is not statistically significant. The reason the acceptance rate is lower in round 2 and 3 is not because the schools are more selective but because on average lower quality candidates apply in those rounds. If you are a qualified candidate, do not worry about applying to Stern in round 3, you still have a good chance of getting in.

Stern Prefers GMAT over GPA

In the past I tried to figure out if Stern prefers a high GMAT or GPA and didn’t come up with anything conclusive. Now that I have built the Stern admissions model I can see how a similar change in GMAT or GPA impact acceptance rate at Stern. In the graph below I compare how much the admissions rate changes if I alter the GMAT or GPA by a standard deviation. If you are applying to business school then you should probably know what a standard deviation is, however if you don’t it is a standard measure of variance in a population or sample. Since I can’t compare an absolute variance because GMAT and GPA are on different scales, I compare how the shift of one standard deviation impacts the Stern acceptance rate.

Stern Acceptance Rate GPA vs GMAT MBA NYU Admissions Business SchoolIn the graph above, you can see that increasing the GPA by one standard deviation (.28) increase acceptance rate by 29%, but raising the GMAT score by one standard deviation (39) leads to a 45% higher chance of admissions. It is clear that Stern prefers candidates with high GMAT score over ones with a high GPA. This is good news for candidates with a low GPA because with enough hard work, you can increase your odds significantly by raising your GMAT.

Other NYU Admissions Insights

I also found that NYU prefers candidates with an average age of 27 to 28, the further you are from this average age, the lower your chance of getting in. Stern really likes candidates that come from consulting. Applicants from consulting had a acceptance rate of 42% vs. 21% for non-consultants. Having more work experience also increased your odds of admissions. Acceptance rate increased by about 2% for each year of work experience. However, once you pass 28, the age deviation factor is significantly stronger than the work experience factor so you shouldn’t wait until after 28 to apply.

I noticed that candidates that majored in business or engineering had a lower chance of admission. Business majors with average scores had a 8% chance of admission compared to 24% for non-business majors. Engineers had a 13% chance of getting in compared to a 26% chance for non-engineers. These differences are statistically significant even after taking into account all other factors. That being said, I majored in engineering and I got into Stern. I also know many other business and engineering majors who are currently attending Stern with me.

Tuck Admissions Analysis

Tuck Admissions Analysis MBA Business SchoolThe final decision for the Tuck MBA January round applications is being released tomorrow. Tuck calls the students who have been accepted either the day of or the day before the decision is released. Today, mostly international acceptance calls were made, and I have not been called yet. I am based in the US so I am not super nervous yet, but I am finding it difficult to think of anything other than the Tuck decision. I was incredibly unproductive at work today because I spent the entire time hoping my phone would ring. To help ease my worries I created this elaborate Tuck admissions analysis to try to figure out my chances of getting in. Each of the following graphs are only acceptance rate vs. one variable. In reality there are probably interaction effects between different variables, so this is by no means especially accurate, but my final conclusion is that I have a 53% chance of being admitted. I was hoping the number would come out higher, but it is a lot better than the 20.8% acceptance rate overall at Tuck.

Tuck Admissions Analysis

Tuck Admissions Analysis GMAT Acceptance Rate MBA

The first variable I looked at was GMAT. I did a scatter-plot by acceptance rate and found the best trendline for fitting the trendline. This line has an R squared of .82, which is a fairly strong correlation. I then created the smoothed out graph below, which probably does a better job of estimating the impact of GMAT on your application odds.

Tuck Admissions Analysis GMAT Acceptance Rate MBA

My 770 on the GMAT really helped to boost my Tuck admissions chances since it is significantly higher than the 718 average. However, I know my GPA is below the average Tuck GPA of 3.5. So next I looked at how GPA impacts acceptance rate.

Tuck Admissions Analysis MBA GPA Acceptance Business School

For Dartmouth, GPA is highly correlated with chance of acceptance, as one would expect. The GPA scatter-plot has a .89 R squared, which is very high. However, the line is not nearly as steep as it is for GMAT. Similar to GMAT, I smoothed out the curve to account for noise and came up with the graph below.

Tuck Admissions Analysis GPA Acceptance MBA Business School Dartmouth

After GPA, I looked at how your industry impacts your chances of getting into Tuck. I only included an industry if it either had a high number of applicants or had a very high acceptance rate, like Venture Capital and Commercial Banking. I lumped all other industries into “other”. The trends for Dartmouth are similar to what I saw in my Wharton industry analysis. Manufacturing fared better with Tuck, but it is still significantly below average.

Tuck Admissions Analysis Industry Acceptance Rate Dartmouth MBA

Finally, I looked at Dartmouth acceptance rate by years of work experience. The results of this graph do not seem to be as conclusive as other variables. The acceptance rate kind of jumps around. My interpretation is that in general the more years of work experience, the higher your chance of admissions is, until you reach 9+ years. Then the admissions committee starts to wonder why you are even applying for an MBA.

Tuck Admissions Analysis Dartmouth MBA Acceptance Rate

All in all, my predicted chance of getting into Dartmouth is pretty decent at 53%. My chance is theoretically a little better than a flip of a coin. I know that very few people who don’t do a applicant initiated interview are invited to a Tuck interview. An admissions committee member told me that roughly 55% of applicants self-initiate interviews, and I am going to guess that only 5% of total applicants are invited. If this is correct, then the fact that I already interviewed means that I have a pretty good chance of getting in. On top of that, I had one recommender who wrote an amazing recommendation for me. I sent it to NYU, Wharton and Tuck. I was admitted to NYU and I have been interviewed at Wharton and am waiting for my final decision. I was rejected from every school that he didn’t recommend me at. I am hoping the trend continues that I get into every school that my super recommender submitted to.

For those of you who are still waiting for the Tuck admissions decision, I hope that this article is able to distract you for a little while while you wait for the decision tomorrow. I wish everyone the best of luck.

The data used to create this Tuck admissions analysis is from GMAT Club. I used the data from the class of 2014, 2015 and the first two rounds of the class of 2016.

Wharton GPA Impact on MBA Acceptance Rate

I posted an updated Wharton acceptance rate analysis which is more accurate than this article. It shows how GPA and GMAT affect your odds of admissions.

Wharton GPA MBA Admissions Acceptance Business School

When applying to a top MBA program, GMAT and GPA are important parts of the application. As one would expect from a top MBA program, at Wharton GPA has a large impact on your chances of admission. The question is how much does your undergraduate GPA affect your chance of admission. I analyzed the acceptance data from the past two and half years at GMAT Club to see how much GPA impacts acceptance rate. Unlike Harvard where there is little benefit from GPA until 3.8 or higher, at Wharton the acceptance rate generally increases as the undergraduate GPA rises.

At Wharton GPA Increases Chance of Admission

Wharton GPA vs. Acceptance rate MBA Business School You can clearly see that acceptance rate is lowest below 3.0 and highest in the 3.8 to 4.0 range. There is a slight dip in the 3.6 to 3.79 GPA range. I took a closer look and it appears to be because more applicants in this GPA range worked in industries that Wharton does not value. There are more applicants in the 3.6 to 3.79 range that work in Government and Mutual Funds and fewer in Military and Venture Capital, which are industries that Wharton seems to prefer.

Higher GPA does appear to increase the chance of an applicant being admitted to Wharton, but the slope is not as steep as I would have expected. Unfortunately for some, GPA is stuck in stone. Applicants who hope to increase their chance of admissions need to focus on GMAT to increase their odds. Luckily, data suggests that very high GMAT scores significantly increase the odds that Wharton will accept an applicant. If an applicant studies hard for the GMAT, then a high GMAT score is highly likely achievable. There are many companies that offer GMAT preparation which will increase your chance of admission.

Wharton does not publish statistics on GPA for us to analyze. However, we can look at what the average GPA is in my data set. The mean GPA for accepts at Wharton in my dataset is 3.61 GPA with a middle 80% GPA in the range of 3.23 to 3.94. The mean Wharton GPA of 3.61 is lower than the mean Harvard GPA of 3.66.

How Much Does Your Industry Affect Your Acceptance Rate at Wharton

If you have any doubt that the industry you are in and what company you work at affect your acceptance rate at top MBA schools, then I have wonderful bridge I can sell you for a bargain. I know, my joke is lame, I should stick to the numbers.

We all know that your industry has a big impact on your acceptance rate, but which industries are the best to work in if you want to get into  a top MBA program like Wharton. First, lets take a look at the distribution of applicants at Wharton by industry. I removed all industries with fewer than 20 applicants over the 3 years I analyzed.

Wharton Industry Distribution MBA Applicants Business School

As you can see, the greatest number of applicants came from consulting and investment banking. I removed the “Other” category from this graph because it was too large in comparison to each individual industry. There were 883 “Other” applicants.

Now what you all are waiting for, which industries are best for getting into Wharton? The answer shouldn’t be too much of a surprise, it is Venture Capital. The biggest surprise for me was that military and defense came in second by a wide margin. I guess risking your life for your country may pay off for some lucky soldiers. I expected consulting acceptance rate to be pretty high, but it was only slightly above average. If you work in manufacturing or mutual funds, then you might want to give up your dream of going to Wharton, my magic eight ball says “Outlook not so good”.

Wharton Acceptance Rate Industry Admissions MBA Business School

If you are really passionate about applying to Wharton, then you have probably already noticed that the average acceptance rate in my graph is only 13% and not the actual acceptance rate of 20%. This is because I get my data from GMAT Club, and not everyone updates their profile with the final decision. I considered scaling all of the numbers up 63% to account for this but the venture capital acceptance rate got a little crazy up at 54%. My theory is that venture capitalists are a lot more likely than your average candidate to update their profile on GMAT Club when they get it.

What is going on with the investment bankers having a below average acceptance rate? Perhaps they come across as too aggressive and arrogant in their interview, or maybe they are too busy working 100 hour weeks to update their profile once they are accepted.