Tag Archives: GMAT

MBA Acceptance Rate by Undergraduate Major

Many applicants may wonder if their undergraduate major impacts their chance of getting into business school. Admissions data suggests that your college major can significantly impact your probability of getting into business school. The general trend seems to be that majors that are more dominated by women have a higher acceptance rate while industries that dominated by men had lower acceptance rates. This could be because my data does not have gender as a variable, so I could not account for it. Many people believe that women’s acceptance rate is higher than it is for men with similar credentials, but I have not found any data that proves it. Another explanation is that the female dominated majors are generally underrepresented in business school application pools, so when schools aim to diversify the class, the acceptance rates are higher for those majors.

Given that there so many different college majors, there is not enough data to analyze major by school, so instead I analyzed the major acceptance rate by school tier. I grouped the top 10, 11 – 16 and 17 – 25.

Ranking Tier
Acceptance Rate
GMAT
GPA
Top 10
20%
728
3.53
11 – 16
35%
716
3.42
17 – 25
45%
705
3.42

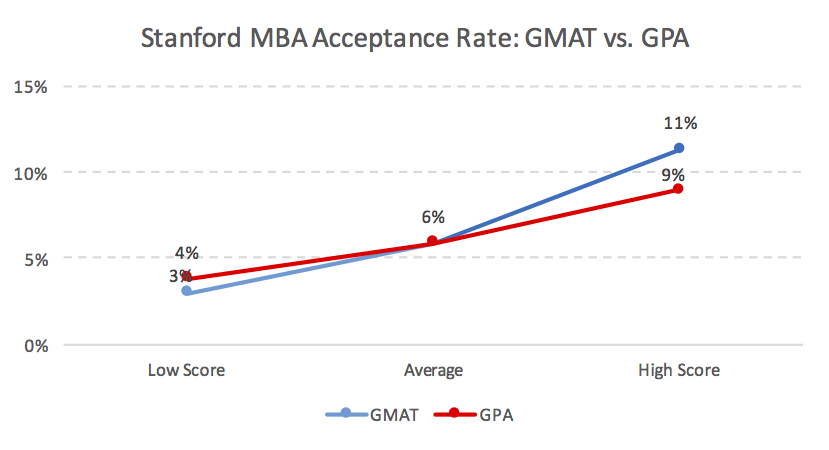
As you can see, the tier has a strong effect on the acceptance rate. GMAT and GPA also correlate strongly with ranking. Below you can see what majors have a higher acceptance rate than we would expect and which have lower acceptance rates, given the GMAT and GPA.

Top 10 MBA Acceptance Rate by Major

In the top 10, education majors have the highest acceptance rate for top 10 MBA programs despite having substantially lower GMAT of 711 compared to the average of 728. Law majors have lower GMAT and GPA, but nearly 50% higher acceptance rate than average. Liberal arts and humanities majors have a noticeably higher acceptance rate despite lower GMAT and similar GPA. Other Majors with high acceptance rates also have higher than average GMAT, which could explain the acceptance rate.

In the top 10, operations majors have substantially higher GMAT and GPA, but only a 16% acceptance rate compared to the average of 20% acceptance rate. Engineering students have similar to average scores, but only 15% acceptance rates. Computer science, marketing and health/medical majors have very low acceptance rates, that may be at least partially explained by low scores.

Major
Acceptance Rate
GMAT
GPA
Education
33%
711
3.71
Law
29%
723
3.37
Liberal Arts and Humanities
24%
724
3.53
Social Services
24%
735
3.61
Political Science
24%
734
3.55
Economics
23%
729
3.51
Communication
20%
727
3.58
Accounting
20%
728
3.62
Finance
19%
726
3.59
Business
18%
723
3.56
Science and Math
17%
733
3.48
Arts
16%
729
3.52
Operations
16%
737
3.56
Engineering
15%
728
3.49
Computer Science
12%
722
3.52
Marketing
9%
718
3.36
Health or Medical
7%
708
3.58

Ranked 11 – 16 MBA Acceptance Rate by Major

In the middle tier of rank 11 to 16, communication majors have an absurdly high acceptance rate with similar GMAT and noticeably higher GPA. Liberal arts majors had very high acceptance rates despite the lower than average GMAT. Political science majors had a high acceptance rate of 40% even though their GMAT and GPA are well below average.

Operations majors have a lower acceptance rate, but it is explained by a fairly low GMAT. Arts majors have a low acceptance rate despite having higher GMAT and GPA than average. Engineering majors have the highest average GMAT for middle tier schools, but one of the lowest acceptance rates. Health/medical majors have a low acceptance rate, but it is explained by very low GMAT of 688. Marketing, computer science and law majors had some of the lowest acceptance rates, but they also had lower than average stats.

Major
Acceptance Rate
GMAT
GPA
Communication
61%
717
3.61
Liberal Arts and Humanities
45%
711
3.45
Economics
45%
717
3.36
Finance
43%
716
3.49
Science and Math
42%
718
3.35
Political Science
40%
706
3.37
Accounting
38%
716
3.49
Business
35%
706
3.46
Operations
31%
701
3.4
Arts
27%
720
3.46
Engineering
26%
721
3.4
Health or Medical
25%
688
3.52
Marketing
23%
712
3.34
Computer Science
23%
713
3.43
Law
17%
709
3.07

Ranked 17 – 25 MBA Acceptance Rate by Major

For rank 17 to 26 schools, communication majors had an extremely high acceptance rate even though they had an average GMAT and an only slightly higher GPA. Economics, political science, liberal arts, marketing, business, law and operations majors all had very high acceptance rates yet lower than average stats.

Health/medical and education majors’ acceptance rates are lower than average, but explained by very low GMAT score. Engineering and arts majors have above average stats, but lower acceptance rates.

Major
Acceptance Rate
GMAT
GPA
Communication
78%
706
3.51
Economics
67%
698
3.32
Political Science
65%
691
3.36
Liberal Arts and Humanities
57%
697
3.43
Marketing
56%
699
3.35
Business
56%
693
3.46
Law
54%
697
3.31
Operations
54%
688
3.3
Accounting
52%
703
3.43
Finance
52%
704
3.46
Other
48%
698
3.41
Science and Math
45%
702
3.33
Health or Medical
40%
663
3.49
Engineering
35%
713
3.42
Arts
35%
722
3.45
Computer Science
31%
704
3.49
Education
13%
663
3.59

MBA Waitlist Acceptance Rate Analysis (with Class of 2019 data)

MBA Waitlist Acceptance Rate Analysis by GMATOne of the most frustrating parts of the MBA application process is waiting to hear back from the schools. First, applicants have to wait to hear if you will be interviewed. Next, an applicant must wait to hear if they have been admitted. Some unlucky souls will have to wait a third time on the waitlist, sometimes for up to 8 months if they are a round 1 applicant. I created this updated MBA waitlist acceptance rate analysis to provide some transparency to those who are on the waitlist.

Unlike the rather stable overall admission rate, the MBA waitlist acceptance rate fluctuates substantially. Some years it is very high for a school and other years it can be zero. The acceptance yield of the school in a given year drives the waitlist acceptance rate. In addition to providing the average acceptance rate from 2012 to 2017, I also included the lowest year and highest year during that period. Some of the smaller schools have a lot less data available, so the acceptance rates below are less reliable.

MBA Waitlist Acceptance Rate and Range

Rank
School
Low
Average
High
1
Harvard University (HBS)
0%
6%
14%
1
University of Pennsylvania (Wharton)
0%
5%
6%
3
University of Chicago (Booth)
3%
17%
35%
4
Stanford University (GSB)
0%
18%
50%
4
Northwestern University (Kellogg)
0%
5%
10%
4
Massachusetts Institute of Technology (Sloan)
2%
9%
17%
7
University of California—​Berkeley (Haas)
0%
7%
15%
8
Dartmouth College (Tuck)
0%
6%
15%
9
Columbia University (CBS)
5%
13%
24%
9
Yale University (YSOM)
0%
9%
21%
11
University of Michigan—​Ann Arbor (Ross)
6%
14%
20%
12
New York University (Stern)
0%
5%
13%
12
Duke University (Fuqua)
2%
5%
11%
14
University of Virginia (Darden)
0%
17%
27%
15
University of California—​Los Angeles (Anderson)
5%
17%
33%
16
Cornell University (Johnson)
0%
10%
19%
17
University of Texas—​Austin (McCombs)
4%
7%
20%
18
University of North Carolina—​Chapel Hill (Kenan-​Flagler)
6%
26%
55%
19
Carnegie Mellon University (Tepper)
0%
9%
22%
20
Emory University (Goizueta)
0%
8%
33%
21
Georgetown University (McDonough)
0%
8%
13%
21
Indiana University (Kelley)
0%
13%
18%
21
Washington University in St. Louis (Olin)
11%
26%
50%
24
University of Southern California (Marshall)
0%
20%
50%
25
Arizona State University (Carey)
0%
12%
20%
25
Vanderbilt University (Owen)
0%
19%
50%

I suspected that some schools would have a higher preference for waitlisted applicants with higher GMATs. I found that schools treated applicants very differently based on GMAT. Some schools have a preference for very high GMATs, while others have a preference average GMATs (for top MBAs). Strangely, some schools have no preference for GMAT while others appear to have a preference for lower GMATs. The data is a little thin, so take this with a grain of salt.

Waitlist acceptance rate for schools with preference for very higher GMATs

School
< 700
700 – 730
740+
Harvard University (HBS)
0%
0%
13%
Stanford University (GSB)
0%
0%
13%
University of Pennsylvania (Wharton)
0%
0%
5%
Columbia University (CBS)
0%
0%
16%

Waitlist acceptance rate for schools that have a preference for higher GMATs

School
< 700
700 – 730
740+
Northwestern University (Kellogg)
6%
2%
11%
Dartmouth College (Tuck)
0%
8%
6%
Duke University (Fuqua)
0%
6%
4%
University of Virginia (Darden)
20%
17%
27%
Georgetown University (McDonough)
0%
14%
20%

Waitlist acceptance rate for schools that have a preference for average GMATs

School
< 700
700 – 730
740+
University of California—​Berkeley (Haas)
0%
6%
3%
Yale University (YSOM)
0%
17%
4%
University of Michigan—​Ann Arbor (Ross)
10%
18%
11%

Waitlist acceptance rate for schools that have preference for lower GMATs

School
< 700
700 – 730
740+
University of California—​Los Angeles (Anderson)
27%
19%
6%
University of Texas—​Austin (McCombs)
8%
9%
6%
Carnegie Mellon University (Tepper)
9%
9%
3%

Waitlist acceptance rate for schools that have no preference for GMAT

School
< 700
700 – 730
740+
University of Chicago (Booth)
18%
15%
19%
Massachusetts Institute of Technology (Sloan)
14%
14%
8%
New York University (Stern)
8%
6%
7%
Cornell University (Johnson)
11%
11%
12%
University of North Carolina—​Chapel Hill (Kenan-​Flagler)
33%
21%
29%

Some schools had data that was too thin to analyze. Those schools are Carey, Emory, Kelley, Olin, Owen, and USC.

MBA Interview Probability for top schools by GMAT and GPA

With round 2 application deadlines rapidly approaching, many applicants may wonder what their chance of getting an MBA interview with their favorite schools is. I analyzed the MBA interview probability for the top 25 schools over the past 5 years by GMAT and GPA. Unsurprisingly, for most schools the MBA interview chance increased for high GMAT and high GPA candidates.

Some interesting insights I found:

  • At Booth, GPA has little to no impact on likelihood of getting and interview unless your GMAT is under 700
  • At Columbia, GMAT and GPA are very important for your interview chances
  • At Cornell, GMAT is far more important than GPA for getting an interview
  • At Duke, neither GPA nor GMAT seem to have much of an impact on interview odds
  • At Emory, strangely, if you have a GMAT of 700 or higher then low GPA applicants actually have a higher chance of getting an interview
  • At Georgetown, chance of getting an interview for 740+ applicants is no more than for those in the 700 to 730 range
  • At Stanford and Harvard, chance of interviewing is depressingly low, both GMAT and GPA are very important
  • At Ross, GPA doesn’t seem to matter if an applicant has a GMAT of 740 or higher
  • At NYU, having a very high GMAT dramatically increases your chance of getting an interview
  • At Wharton, having a high GMAT only appears to matter if the applicants GPA is over 3.40
  • At Yale, both GMAT and GPA have a huge impact on chance of getting an interview

University of Chicago (Booth) MBA Interview Probability

< 700
700 – 730
740+
< 3.40
33%
52%
68%
3.40 – 3.59
28%
53%
67%
3.60+
58%
59%
73%

Arizona State University (Carey) MBA Interview Probability

< 700
700 – 730
740+
< 3.40
56%
53%
75%
3.40 – 3.59
58%
33%
100%
3.60+
52%
62%
75%

Carnegie Mellon University (Tepper) MBA Interview Probability

< 700
700 – 730
740+
< 3.40
67%
61%
74%
3.40 – 3.59
48%
62%
80%
3.60+
53%
49%
77%

Columbia University MBA Interview Probability

< 700
700 – 730
740+
< 3.40
19%
25%
43%
3.40 – 3.59
17%
34%
54%
3.60+
28%
43%
55%

Cornell University (Johnson) MBA Interview Probability

< 700
700 – 730
740+
< 3.40
46%
62%
69%
3.40 – 3.59
48%
61%
68%
3.60+
54%
58%
72%

Duke University (Fuqua) MBA Interview Probability

< 700
700 – 730
740+
< 3.40
58%
64%
65%
3.40 – 3.59
57%
58%
62%
3.60+
76%
63%
66%

Emory University (Goizueta) MBA Interview Probability

< 700
700 – 730
740+
< 3.40
47%
55%
78%
3.40 – 3.59
44%
52%
57%
3.60+
52%
43%
62%

Georgetown University (McDonough) MBA Interview Probability

< 700
700 – 730
740+
< 3.40
65%
74%
72%
3.40 – 3.59
65%
88%
85%
3.60+
71%
85%
89%

Stanford University (GSB) MBA Interview Probability

< 700
700 – 730
740+
< 3.40
3%
3%
12%
3.40 – 3.59
6%
12%
18%
3.60+
13%
14%
22%

University of California—​Berkeley (Haas) MBA Interview Probability

< 700
700 – 730
740+
< 3.40
12%
27%
22%
3.40 – 3.59
28%
27%
44%
3.60+
27%
39%
50%

Harvard University (HBS) MBA Interview Probability

< 700
700 – 730
740+
< 3.40
5%
10%
13%
3.40 – 3.59
12%
15%
18%
3.60+
12%
24%
27%

Indiana University (Kelley) MBA Interview Probability

< 700
700 – 730
740+
< 3.40
44%
57%
75%
3.40 – 3.59
39%
70%
70%
3.60+
34%
76%
84%

Northwestern University (Kellogg) MBA Interview Probability

< 700
700 – 730
740+
< 3.40
67%
82%
80%
3.40 – 3.59
56%
77%
86%
3.60+
60%
76%
83%

University of Texas—​Austin (McCombs) MBA Interview Probability

< 700
700 – 730
740+
< 3.40
44%
68%
76%
3.40 – 3.59
51%
74%
81%
3.60+
60%
75%
82%

Washington University in St. Louis (Olin) MBA Interview Probability

< 700
700 – 730
740+
< 3.40
58%
76%
88%
3.40 – 3.59
62%
77%
91%
3.60+
74%
86%
80%

Vanderbilt University (Owen) MBA Interview Probability

< 700
700 – 730
740+
< 3.40
74%
80%
56%
3.40 – 3.59
66%
74%
83%
3.60+
94%
83%
92%

University of Michigan—​Ann Arbor (Ross) MBA Interview Probability

< 700
700 – 730
740+
< 3.40
50%
57%
72%
3.40 – 3.59
54%
65%
70%
3.60+
50%
68%
70%

Massachusetts Institute of Technology (Sloan) MBA Interview Probability

< 700
700 – 730
740+
< 3.40
14%
26%
24%
3.40 – 3.59
0%
24%
33%
3.60+
26%
39%
39%

New York University (Stern) MBA Interview Probability

< 700
700 – 730
740+
< 3.40
24%
28%
44%
3.40 – 3.59
35%
41%
58%
3.60+
13%
37%
56%

Dartmouth College (Tuck) MBA Interview Probability

< 700
700 – 730
740+
< 3.40
58%
66%
71%
3.40 – 3.59
38%
64%
82%
3.60+
65%
73%
74%

University of California—​Los Angeles (Anderson) MBA Interview Probability

< 700
700 – 730
740+
< 3.40
26%
40%
57%
3.40 – 3.59
23%
60%
70%
3.60+
24%
60%
69%

University of North Carolina—​Chapel Hill (Kenan-​Flagler) MBA Interview Probability

< 700
700 – 730
740+
< 3.40
72%
68%
89%
3.40 – 3.59
59%
71%
83%
3.60+
63%
73%
90%

University of Southern California (Marshall) MBA Interview Probability

< 700
700 – 730
740+
< 3.40
38%
74%
67%
3.40 – 3.59
52%
74%
75%
3.60+
28%
71%
85%

University of Virginia (Darden) MBA Interview Probability

< 700
700 – 730
740+
< 3.40
40%
41%
58%
3.40 – 3.59
36%
39%
73%
3.60+
50%
54%
60%

University of Pennsylvania (Wharton) MBA Interview Probability

< 700
700 – 730
740+
< 3.40
29%
35%
33%
3.40 – 3.59
26%
27%
46%
3.60+
29%
36%
55%

Yale University (YSOM) MBA Interview Probability

< 700
700 – 730
740+
< 3.40
15%
31%
42%
3.40 – 3.59
24%
41%
63%
3.60+
34%
53%
67%

Military MBA Acceptance Rate Analysis

Military MBA Acceptance Rate Analysis - GMAT GPA AgeTransitioning from the military to MBA is a fairly popular path to follow. A little over 4% of MBA applications come from military veterans. When looking at the data comparing military applicants to traditional MBA applicants, a few trends become clear:

  • Military / Veteran applicants tend to be a year or two older.
  • Scores for military applicants are a little lower on average, about 15 points on the GMAT and about .15 for GPA
  • Military applicants on average have another year or two of work experience
  • Military MBA acceptance rate is about 50% higher than the acceptance rate for traditional applicants
  • Some schools have a very large advantage for military applicants while others have little to no advantage

For the purposes of this article, I define traditional applicants as individuals that have worked in finance, marketing, accounting, retail, STEM and healthcare. They make up around 86% percent of MBA applicants. I excluded applicants that had a background in education, entertainment, sports, hospitality, tourism, human resources, journalism, publishing, government and non-profit.

Military applicants on average have the highest acceptance rate despite having the lowest average scores. My hypothesis is that they tend to have more significant leadership experience than other applicants and tend to do well in job placement. They also know how to operate well under pressure. These traits are desirable for MBA programs.

Military MBA Acceptance Rate by Tier

For the purposes of this analysis, I broke the schools into tiers since not all schools have enough data on military applicants to look at individually.

  • Tier 1 is defined as the schools ranked 1 through 7: Harvard, Wharton, Booth, Stanford, Sloan, Kellogg and Haas.
  • Tier 2 is defined as schools ranked 8 through 14: Tuck, Yale, Columbia, Ross, Stern, Fuqua and Darden.
  • Tier 3 is defined as schools ranked 15 through 25: Anderson, Johnson, McCombs, Kenan-​Flagler, Tepper, Goizueta, McDonough, Kelley, Olin, Marshall, Carey and Owen.
Tier
Applicant Group
Accepted
GMAT
GPA
Age
1
Traditional
14%
727
3.53
27.3
1
Military & Defense
23%
719
3.39
28.4
2
Traditional
25%
718
3.45
27.3
2
Military & Defense
39%
705
3.28
28.9
3
Traditional
37%
709
3.43
27.1
3
Military & Defense
55%
685
3.23
28.8

As you can see, military applicants have a substantial advantage at tier 1, 2 and 3 schools. The tier with largest lift is actually tier 1, which has a 62% higher acceptance rate for military applicants compared to traditional applicants. Military applicants had a 58% higher acceptance rate for Tier 2 schools and 49% for tier 3. Military applicants had the smallest score gap for tier 1 schools and the largest gap for tier 3 where military applicants had a GMAT that is 24 points lower.

Military MBA Acceptance Rate Lift

School
Military Acceptance Rate Lift
Harvard University (HBS)
117%
University of Michigan—​Ann Arbor (Ross)
94%
Duke University (Fuqua)
90%
University of Pennsylvania (Wharton)
75%
Massachusetts Institute of Technology (Sloan)
71%
Northwestern University (Kellogg)
57%
Columbia University (CBS)
39%
Dartmouth College (Tuck)
36%
University of Texas—​Austin (McCombs)
30%
University of Virginia (Darden)
19%
University of Chicago (Booth)
11%

The chart above shows how much higher the acceptance rate for military applicants is compared to traditional applicants. Harvard had the highest lift, where military applicants are more than twice as likely to get accepted. At the other end of the spectrum is Booth, where military applicants only have a 11% advantage over traditional applicants. My advice for military applicants is to apply to Ross and Duke. They are really strong schools with a greater than 50% chance of admission. I only included schools where there is enough data.

I looked at the acceptance rates for the other schools but there wasn’t enough data to publish an actual number. So I grouped them into categories.

  • Schools with a large lift ( greater than 70%): Haas, Emory, Tepper, and Kelley
  • Schools with a medium lift (30% to 60%): Stern, Anderson, Johnson, and Marshall.
  • Schools with little to no lift (lower than 30%): Stanford, Georgetown, Olin, Owen, Carey, UNC, and Yale.

I plan to do a similar analysis for other non-traditional applicants in the near future.

Best Schools for Young MBA Applicants

Deciding when to start applying to business school can be a challenge. Salary increases dramatically after an MBA, but schools tend to prefer applicants with more work experience. I looked at the top 25 US MBA programs’ admission data to find the best schools for young MBA applicants in terms of chance of being admitted. I analyzed the MBA acceptance rate by age to see which schools had the smallest disadvantage for younger applicants relative to traditionally aged MBA applicants.

How Many MBA Applicants are Young?

I defined an applicant as young if they are 25 or younger. I compared the young MBA applicants to those who are the more typical age range of 26 to 29. Over the past 5 years, the number of young applicants has increased significantly from 13% of the applicant pool to 21% over the past 5 years. Despite the increase in supply of young applicants, there has not been a drop in acceptance rate for younger candidates.

MBA Applicant Age Distribution

MBA Applicant Age Distribution

The rise in applications from younger applicants could be driven by some schools adopting programs specifically targeted at undergraduates. Harvard has the 2+2 program that allows undergraduates to apply to HBS while they are still in school. Those who are accepted must spend at least 2 years working full time before starting their MBA. NYU Stern also has a program targeted towards undergraduates called the Berkley Scholars. It is a very selective program where 5 to 6 undergraduates will get a full ride and a stipend for living expenses. Unlike Harvard’s 2+2 program, Berkley Scholars start their MBA immediately. The Berkley Scholars tend to do very well. From the class of 2016, two of the scholars joined McKinsey and one went to BCG.

Best Schools for Young MBA Applicants

Almost every school in the top 25 penalizes young applicants in admissions. On average young applicants have only 2.5 years of work experience which, is 2 years lower than traditionally aged applicants that are 26 to 29. Most of the best schools for young MBA applicants still moderately penalize younger applicants. Stanford is the only school that actually gives young applicants an advantage when they apply. My hypothesis is that it is related to their affinity for startups. If a young person has a great idea for a startup, will 2 more years working as a low level analyst really improve the odds of it working out? In the table below, the “Disadvantage for <25” column shows how much lower the odds are for a young applicant to be admitted. For example at MIT an applicant that is 26 to 29 has a 16% acceptance rate. The disadvantage factor is -10%, so the young MBA acceptance rate is 14.4%. I have included the average GMAT and GPA for reference.

School
Disadvantage
for <25
GMAT
(<25)
GMAT
(26 – 29)
GPA
(<25)
GPA
(26 – 29)
Stanford University (GSB)
52%
733
731
3.57
3.59
Washington University in St. Louis (Olin)
3%
719
712
3.52
3.46
Massachusetts Institute of Technology (Sloan)
-10%
720
729
3.56
3.52
Carnegie Mellon University (Tepper)
-16%
714
714
3.43
3.39
Georgetown University (McDonough)
-20%
699
699
3.43
3.35
University of North Carolina—​Chapel Hill (Kenan-​Flagler)
-26%
709
712
3.42
3.37
Cornell University (Johnson)
-28%
712
715
3.32
3.36
Columbia University (CBS)
-29%
722
726
3.55
3.49
Vanderbilt University (Owen)
-30%
698
692
3.49
3.34
University of Virginia (Darden)
-35%
723
718
3.44
3.39

Worst Schools for Young MBA Applicants

These schools are at the complete other end of the spectrum. These MBA programs severely penalize young applicants. It is interesting to see Berkeley, the other top California school, treats young applicants completely contrary to Stanford. Young applicants have a 72% lower chance of being admitted then applicants 26 to 29, despite the young applicants having higher GMAT and GPA. I was a little shocked to see Harvard featured so prominently on the list of worst schools for young MBA applicants given that they have the 2+2 program to attract young talent.

School
Dissadvantage for <25
GMAT
(<25)
GMAT
(26 – 29)
GPA
(<25)
GPA
(26 – 29)
University of California—​Berkeley (Haas)
-72%
722
721
3.56
3.51
University of Michigan—​Ann Arbor (Ross)
-64%
721
720
3.33
3.41
Harvard University (HBS)
-63%
731
732
3.59
3.58
Arizona State University (Carey)
-52%
690
687
3.46
3.41
University of Pennsylvania (Wharton)
-52%
734
731
3.56
3.55
Duke University (Fuqua)
-50%
716
717
3.46
3.42
University of Texas—​Austin (McCombs)
-49%
717
708
3.38
3.44
Dartmouth College (Tuck)
-48%
716
727
3.51
3.46
Indiana University (Kelley)
-47%
694
698
3.43
3.39
Yale University (YSOM)
-46%
713
724
3.49
3.47
University of California—​Los Angeles (Anderson)
-45%
720
718
3.48
3.47
University of Chicago (Booth)
-44%
726
731
3.56
3.52
Emory University (Goizueta)
-44%
714
705
3.46
3.37
Northwestern University (Kellogg)
-42%
730
724
3.5
3.49
New York University (Stern)
-41%
711
718
3.47
3.43
University of Southern California (Marshall)
-40%
703
707
3.52
3.42

MBA Acceptance Rate by Age Group

For reference, here are the raw MBA acceptance rates by age group for each school. I also looked at older applicants and plan to do a follow-up article focusing on applicants that are 30 years old and older.

Rank
School
<= 25
26 – 29
30+
1
Harvard University (HBS)
4%
12%
12%
1
University of Pennsylvania (Wharton)
10%
22%
15%
3
University of Chicago (Booth)
16%
28%
18%
4
Stanford University (GSB)
8%
5%
5%
4
Northwestern University (Kellogg)
14%
24%
26%
4
Massachusetts Institute of Technology (Sloan)
14%
16%
11%
7
University of California—​Berkeley (Haas)
4%
16%
8%
8
Dartmouth College (Tuck)
14%
27%
17%
9
Columbia University (CBS)
15%
21%
13%
9
Yale University (YSOM)
13%
24%
16%
11
University of Michigan—​Ann Arbor (Ross)
14%
40%
36%
12
New York University (Stern)
15%
26%
14%
12
Duke University (Fuqua)
13%
26%
24%
14
University of Virginia (Darden)
23%
36%
19%
15
University of California—​Los Angeles (Anderson)
14%
24%
22%
16
Cornell University (Johnson)
28%
40%
41%
17
University of Texas—​Austin (McCombs)
19%
37%
29%
18
University of North Carolina—​Chapel Hill (Kenan-​Flagler)
30%
41%
42%
19
Carnegie Mellon University (Tepper)
34%
40%
38%
20
Emory University (Goizueta)
22%
39%
42%
21
Georgetown University (McDonough)
39%
49%
46%
21
Indiana University (Kelley)
22%
42%
56%
21
Washington University in St. Louis (Olin)
34%
33%
38%
24
University of Southern California (Marshall)
24%
40%
35%
25
Arizona State University (Carey)
19%
39%
62%
25
Vanderbilt University (Owen)
35%
50%
63%

Are you curious what round to apply during? Check out my article on MBA Acceptance Rate by round.

MBA Acceptance Rate by Round (class of 2018 data included)

The third round of MBA applications is notorious for having a lower acceptance rate. With the third round application deadlines approaching quickly for most business schools, you may be wondering if the stereotype about the third round is fact or fiction. I updated my analysis of MBA acceptance rate by round with the last 2 years of data and I expanded it to include Olin, Georgetown, USC, Arizona State and Vanderbilt.

This analysis was done using self-reported data from GMAT Club. Data from the class of 2014 through the class of 2018 was used because otherwise there would not be enough data for round 3 and 4 to accurately capture the acceptance rate.

MBA Acceptance Rate by Round Key Takeaways

  • At almost all top 15 schools applicants have a moderate to significant disadvantage when applying during the 3rd and 4th round
  • Applicants to schools ranked 16 to 25 had little to no disadvantage when applying in the 3rd and 4th round
  • On average, top 15 schools had a much larger drop in applicant GMAT from round 1 to round 3 (16 points) than the rest of the top 25 (4 points), but GPA decline was identical (.07)
  • Schools with the largest drop in acceptance rate from round 1 to 3 also had the largest drop in GMAT (20 points)
  • Schools with moderate drop in acceptance rate from round 1 to 3 had a smaller drop in GMAT (10 points)
  • Schools that have no disadvantage when applying 3rd round had almost no drop in GMAT (3 points)

Schools where round doesn’t matter

Although 60% of the top 25 schools are noticeably impacted by which round you apply, several schools don’t appear to care when you apply. Stanford GSB and NYU Stern are the only two schools in the top 15 that are not influenced by which round an applicant applies. Cornell, UNC, Tepper, Emory, Kelley, USC, ASU and Vanderbilt all appear to be unaffected by which round a candidate applies.

Schools where round has moderate impact

Many schools in the across the entire top 25 are moderately impacted by application round. This include top 15 schools such as Kellogg, Tuck, CBS (rolling admission), Ross and Duke. McCombs, Georgetown and Olin are all only minimally impacted by application round.

Schools where round has high impact

Only schools in the top 15 seem to be highly impacted by applying 3rd round. HBS, Wharton, Haas and Darden are most impacted by round. Booth, Sloan, Yale and UCLA are also significantly affected by application round.

MBA Acceptance Rate by Round

Rank
School
R1
R2
R3
R4
1
Harvard University (HBS)
13%
8%
4%
1
University of Pennsylvania (Wharton)
20%
20%
0%
3
University of Chicago (Booth)
26%
23%
13%
4
Stanford University (GSB)
6%
6%
6%
4
Northwestern University (Kellogg)
22%
20%
13%
4
Massachusetts Institute of Technology (Sloan)
18%
10%
Low data
7
University of California—​Berkeley (Haas)
14%
14%
6%
Low data
8
Dartmouth College (Tuck)
26%
24%
20%
7%
9
Columbia University (CBS)
20%
16%
9
Yale University (YSOM)
21%
21%
11%
11
University of Michigan—​Ann Arbor (Ross)
26%
31%
24%
12
New York University (Stern)
19%
22%
22%
Low data
12
Duke University (Fuqua)
24%
23%
15%
14
University of Virginia (Darden)
29%
28%
13%
15
University of California—​Los Angeles (Anderson)
19%
22%
9%
16
Cornell University (Johnson)
33%
33%
31%
33%*
17
University of Texas—​Austin (McCombs)
32%
28%
24%
Low data
18
University of North Carolina—​Chapel Hill (Kenan-​Flagler)
26%
33%
44%
38%
19
Carnegie Mellon University (Tepper)
25%
36%
34%
Low data
20
Emory University (Goizueta)
27%
35%
32%
25%*
21
Georgetown University (McDonough)
41%
47%
32%
21
Indiana University (Kelley)
22%
39%
34%
21
Washington University in St. Louis (Olin)
31%
31%
27%
28%
24
University of Southern California (Marshall)
26%
32%
23%*
25
Arizona State University (Carey)
37%
20%
37%
Low data
25
Vanderbilt University (Owen)
41%
41%
49%
45%*

Check out the upcoming deadlines for round 3 and 4.

*Very few data points are available, so confidence on the accuracy is also low.

INSEAD Acceptance Rate

INSEAD MBA Business School AdmissionThis article will analyze the model I built to predict INSEAD acceptance rate. INSEAD is a graduate business school in France, near Paris. It has two additional campuses in Singapore and Abu Dhabi. In addition to the MBA program, INSEAD also has an Executive MBA, Masters in Finance and a PHD in Management. Unlike most business schools in the US, INSEAD’s full-time program only offers a 1-year MBA. INSEAD students can either start in September or January. The January start is a 12-month program for students who would like to do an internship. The September start is a 10-month program. INSEAD prides itself on being a global business school, thus, it requires applicants to speak two languages fluently before being admitted. In order for a student to graduate, they must speak three languages. On average, INSEAD MBA acceptance rate is 31%. The average GMAT is 703 and the average GPA is 3.5.

INSEAD Acceptance Rate by Starting Semester

INSEAD Acceptance Rate by Starting Semester Business School Admission ChanceSimilar to Columbia, INSEAD has two start options. Since many MBAs are hoping to use their MBA to transition into a new industry, there is much more competition for the January start because it allows for an internship during the summer. Since fewer people apply for the September starting semester, their chance of admission is 70% higher than that of the January applicants. September INSEAD applicants have a 39% acceptance rate compared to only 23% for January applicants.

INSEAD Acceptance Rate by GMAT

INSEAD Acceptance Rate by GMAT Business School Admission Chance

GMAT has a large impact on an applicant’s chance of admission at INSEAD. It is especially important for those applying for January. A 100-point increase from 650 to 750 would raise January acceptance rate from 12% to 37%, which is a 208% increase in chance of admission. A similar increase in GMAT for a September applicant would only increase chance of admission by 140%.

INSEAD Acceptance Rate by GPA

INSEAD Acceptance Rate by GPA Business School Admission ChanceA high GPA can increase your odds of getting into INSEAD. Both start semesters get a healthy boost in chance of admission from a high GPA. Interestingly, a January applicant with a 4.0 has a similar acceptance rate, at 30%, as a September applicant with a 3.0.

INSEAD Acceptance Rate: GMAT vs. GPA

INSEAD Acceptance Rate GMAT vs GPA Business School Admission ChanceAlthough both GMAT and GPA are both important for admission into INSEAD, GMAT is more important. Getting a high GPA (one standard deviation above average) will increase chance of admission 5%. However, a high GMAT will increase your chance of admission by 13%.

INSEAD Acceptance Rate by Geography

INSEAD Acceptance Rate by Country Business School Admission ChanceCitizenship has a significant impact on INSEAD acceptance rate. Indian applicants face tough competition for a spot as an MBA student at INSEAD. Indian applicants have an acceptance rate of only 12%. Admission to INSEAD is much easier for Americans, with an average acceptance rate of 31%. No other country had enough applicants to be statistically significant, so I grouped all other countries into the category of “International”, which had an acceptance rate of 49%.

The data I used to create the INSEAD model came from GMAT Club.

Optimal MBA Application Number

Many business school applicants wonder how many MBA applications they should submit? In this article, I will discuss the optimal MBA application number based on real data. Deciding on your MBA application number is challenging because the more schools you apply to, the less time you have to spend on each application. On the other hand, you don’t want to put all of your eggs into one or two baskets. The data suggests that the ideal number of MBA applications is 5 to 7. For more information, check out this article on how to build your portfolio of MBA applications co-authored by Lawrence Linker and I.

Distribution of Number of MBA Applications

Distribution of MBA Application NumberFor this analysis, I used MBA application data from GMAT Club forums, which is self reported admissions data. By matching usernames across different school applications, I was able to get the number of MBA applications submitted. It seems strange to see that a third of applicants only applied to one school. I would have expected more applicants to apply to 5 or more schools. Even if we assume the source is slightly biased and ignore those who apply to only one school, two thirds of the remaining applicants still apply to only 4 or fewer schools.

MBA Acceptance Rate by MBA Application Number

MBA Acceptance Rate by MBA Application NumberThis graph is possibly the most important piece of information for applicants who are considering applying to a lot of schools. It shows that average acceptance rate per application is relatively flat if you apply to seven or fewer MBA programs, at around 24%. However, if you apply to more than seven schools then acceptance rate plummets to lower than 15%. Those few individuals who apply to 10 or more schools only have a meager 6% acceptance rate. Perhaps there are alternative explanation as to why these acceptance rates drop so much, such as GMAT or GPA of the applicants.

GMAT and GPA by Number of MBA Applications

GMAT and GPA by MBA Application NumberDespite having the highest average GMAT and GPA, applicants who apply to 8 schools have an acceptance rate of only 13%. This supports the idea that if you apply to many schools then you don’t have as much time to commit to each application, so quality decreases. Those who apply to 9 or 10+ schools tend to have lower GPAs while those who apply to 1 school tend to have lower GMATs. People who apply to 6 to 8 schools on average have the highest combined scores.

Also applicants that don’t get in for round 1 often apply during round 2 or 3. I found that 63% of applicants who applied to 2 to 5 schools applied to all schools in the same round while only 25% of applicants who applied to 6+ schools applied to all schools in the same round. Surprisingly there wasn’t much of a difference in average acceptance rate for those who applied to all schools in one round vs multiple rounds except for 8+. When applicants applied to 8 or more schools in one round, the acceptance rate was 50% lower than applicants who applied to 8 or more schools but did it in multiple rounds. So if you plan to apply to many schools, spread it out over a few rounds.

Accepted to at Least One School by MBA Application Number

Accepted to at Least One MBA ProgramThe next question is how likely is an applicant to get into at least on MBA program? If you want at least a 50% chance of being admitted, you should apply to 4 or more schools. The peak is 65% for those applying to 7 schools. If acceptances were completely random with a 25% acceptance rate and 7 applications, we would expect 87% to get into at least one school. This gap suggests that the applicants who are accepted tend to get into many schools while 35% are rejected by everyone. Similarly, for those applying to 5 schools, we expect 75% to get at least one acceptance but only 58% are admitted. I expect that this is because there is a major flaw in their application and they repeat it with every school. This is one of the reasons I suggest applicants use an admission consultant for at least one school. Catch the mistake early with the first school and you will be in much better shape.

Average Number of MBA Acceptances

Average Number of MBA AcceptancesThe graph above shows how many schools applicants got into, if they were accepted to at least one school. Unsurprisingly, those who applied to many schools were more likely to have a choice.

MBA Rank Comparison

MBA Application Number Rank AcceptedThe final graph shows the average school rank of the schools applied to verses the school to which they were admitted. I excluded applicants who did not get into at least one school. It is not shocking that applicants tended to get into lower ranked schools than the average rank of their applications. The big takeaway here is that the gap is much smaller for applicants that submitted 5 or fewer applications. For applicants with 2 to 5 applications, the average school accepted is 2 ranks worse than the average application. For applicants with 6+ applications, the average school accepted is 3.2 ranks worse than the average application. So applying to many schools degrades your chance of being accepted to the most elite MBA programs.

In conclusion, there are many considerations when deciding how many MBA applications to submit. Most of the data suggests that an applicant should apply to 5 to 7 schools to maximize their chance of getting into at least one school. If you want to raise your chance of being accepted to at least one MBA program above the 65% figure for 7 applications, I recommend you hire a consultant to help you craft your essays and avoid major mistakes rather than just submitting more applications.

UNC MBA Acceptance Rate Analysis

Kenan-Flagler is University of North Carolina’s business school. UNC has five programs including a full-time MBA, various executive MBAs and an online MBA program. UNC’s MBA program is currently ranked 18th by US News and World Report. The UNC MBA class of 2017 has an average GMAT of 710 and GPA of 3.4. I built a logistic regression to predict an applicant’s chance of admission to UNC, here are the insights I gained from it.

UNC MBA Acceptance Rate by GMAT

Kenan-Flagler UNC MBA Acceptance Rate by GMAT AdmissionGMAT has a very high impact on acceptance rate at UNC. Increasing your GMAT by just 50 points from 650 to 700 increases your chance of being accepted by 56%.

UNC MBA Acceptance Rate by GPA

Kenan-Flagler UNC MBA Acceptance Rate by GPA AdmissionUndergraduate GPA has little to no impact on UNC MBA acceptance rate. Surprisingly, applicants with a 4.0 actually had a lower acceptance rate than those with a GPA below 3.0. Applicants with a low GPA should certainly consider applying to Kenan-Flagler.

UNC MBA Acceptance Rate by Application Round

Kenan-Flagler UNC MBA Acceptance Rate by Application Round AdmissionI was very shocked to see that acceptance rate was so much higher for round 3 than for round 1 and 2. I looked at the GMAT and GPA to see if that explained the difference and it did not. Round 3 applicants had the lowest average GMAT and GPA.

Round
GMAT
GPA
Round 1
710
3.42
Round 2
710
3.38
Round 3
707
3.35

Other Factors

Applicants that majored in science, math and computer science tended to have high acceptance rates. On the other hand applicants who worked in computer software tended to have a lower acceptance rate. Indian citizens have a much lower chance of admission. US applicants have a 50% acceptance rate, but Indian applicants have an 18% chance of getting admitted.

Stanford MBA Acceptance Rate Analysis

When I first built the Stanford MBA acceptance rate model, it showed that GPA had little to no impact on acceptance rate. I have reevaluated the data and now I believe that GPA does matter when applying to Stanford. Although GPA has an impact on acceptance, GMAT is still more important for Stanford MBA admissions.

Stanford MBA Acceptance Rate by GMAT

Stanford MBA Acceptance Rate by GMAT Business School AdmissionGMAT is very important when applying to Stanford’s business school. When an applicant increases their GMAT by 100 points, from 650 to 750, they increase their chance of admission 8 fold. Average GMAT is over 730 points, which means an applicant must have a GMAT north of 750 for an acceptance rate in the double digits.

Stanford MBA Acceptance Rate by GPA

Stanford MBA Acceptance Rate by GPA Business School AdmissionMy new analysis demonstrates that GPA is actually important when applying to Stanford GSB. The average GPA of a Stanford applicant is 3.56. Each “.10” increase in GPA raises acceptance rate at Stanford by approximately 1%.

Stanford MBA Acceptance Rate GMAT vs. GPA

Stanford MBA Acceptance Rate by GPA Business School AdmissionAlthough both GMAT and GPA are important factors that influence an applicant’s chance of admission to Stanford Graduate School of Business, GMAT is more important than GPA. A high GMAT increases acceptance rate at Stanford by 5%*. On the other hand, a high GPA only increase acceptance rate by 3%.

I was not happy with the original predictive model I built for Stanford. I updated my methodology for building the model, mainly in the way I cleaned the data. The results above represent my new model. Below I compare the performance of the old and new model. In order to evaluate performance, I grouped applicants into buckets based on their predicted acceptance rate, then looked at the actual acceptance rate was for that group. The X-axis is the predicted acceptance grouping and the Y-axis is the actual acceptance rate.

Original Stanford MBA Model Performance

Original Stanford MBA Acceptance Rate Model PerformanceAlthough the graph above looks like it does a good job of predicting the acceptance rate at Stanford. The results are deceptive because almost all of the population fall into the 3% – 6% or 6% – 9% groups, which have little separation.

New Stanford MBA Model Performance

New Stanford MBA Acceptance Rate Model PerformanceThe new model clearly shows significant differentiation, with the exception of the 6% – 9% group. The biggest problem is that the 6% – 9% group has an acceptance rate that is over estimated and the above 9% population is under estimated. The main difference between the original model and new model is the distribution of predictions seen below.

Stanford MBA Model Distribution: New vs. Old

Stanford MBA Acceptance Rate Model Population DistributionIn the original model, 82% of all applicants  fell into the 3% to 9% range with only 5% of applicants below 3% or above 12%. The new model has a much more even distribution of applicants. The number of low and high acceptance rate applicants has increased from 5% to 24%.

Data used to create this post came from GMAT Club, which is one of the best websites for preparing for the GMAT.

*A high GMAT or high GPA is defined as one standard deviation above average. A low score is defined as one standard deviation below.

Contact MBA Data Guru

If you have any questions about this article, please feel free to reach out to me with this form.
Name:*

E-mail:*
Subject:*
Details: