Tag Archives: Columbia

MBA Concentration Acceptance Rate Analysis

With the current semester just about over, next years application essay questions will be posted in the coming weeks for many schools. Round one applicants should start figuring out their story and crafting their essays. The most important essay for most schools is the question: Why get an MBA and why is [insert school name here] the right choice for you? In order to answer this question you need to have a plan for how an MBA is going to help you achieve your goals. The vast majority of MBA students are looking to switch careers. Why else pay $120,000 in tuition and give up two years of salary? If you wanted to stay in the same industry, you would probably just go for a promotion or switch companies.

I was curious if the industry an applicant is trying to transition into impacts their MBA acceptance rate. My theory was that there are a lot of people trying to transition into consulting, banking and technology, so there may be oversupply for those concentrations. Perhaps a candidate would stick out if they are pursuing a more unique career. I took the business school admissions data from GMAT Club and looked at the acceptance rate by stated concentration. First I decided to look at the top 20 schools in aggregate, to ensure the results were statistically significant. I was surprised by how much the acceptance rate varied depending on MBA concentration.

MBA Acceptance Rate by Concentration

MBA Concentration Acceptance Rate Business School
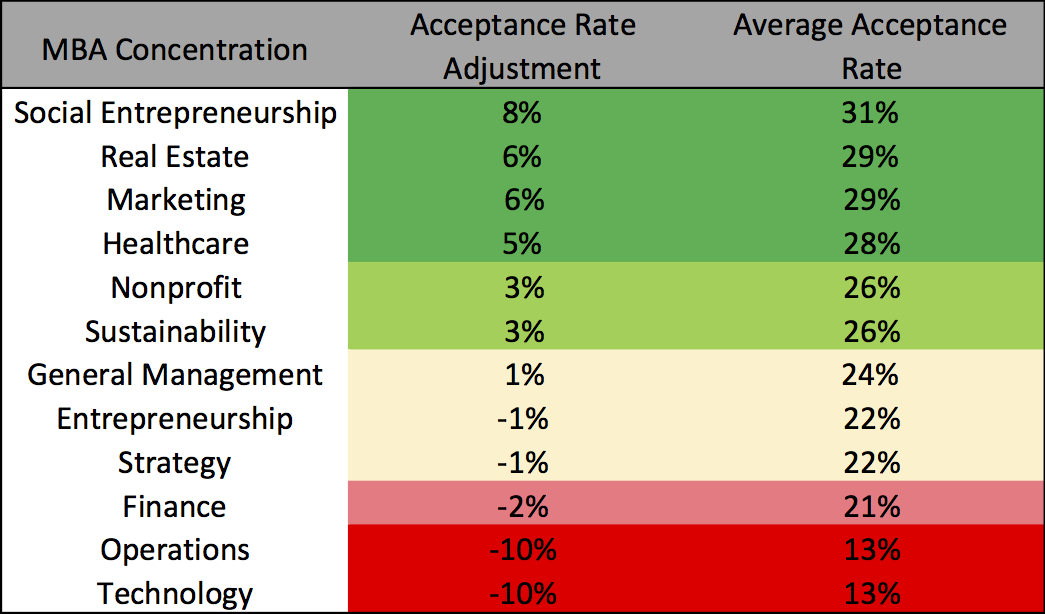
The average acceptance rate for top 20 schools is 23%. Many of the concentrations towards the top are fairly small with the exception of Marketing. As you can see, there is a huge range in the acceptance rates based on industry focus. With Social Entrepreneurship applicants 2.5 times more likely to be admitted than applicants interested in Technology or Operations. Most of the results don’t surprise me, business schools seem to be trying to help the world right now, so it is no shock that Social Entrepreneurship, Nonprofit and Sustainability are all in the top half. With the crisis in the Healthcare industry, the high acceptance rate for Healthcare applicants is also logical I am a little surprised that Real Estate is so high and Technology is so low. There is not a lot of focus on Real Estate that I have seen in business school, so I didn’t expect it to be the concentration with the second highest acceptance rate. On the other hand, Technology is very hot right now, so it is shocking the admissions rate is so low.

Since this data does not have gender included, it is possible that the acceptance rates are skewed by gender concentrations. More women tend to focus on Nonprofit, Social Entrepreneurship, Marketing and Healthcare, which could have bumped up the acceptance rate. Many schools are trying to increase their female enrollment, so women tend to have higher acceptance rates. At the other end of the spectrum, industries such as Operations and Technology are more dominated by men, which likely led to the low acceptance rates in those concentrations.

In the end, I wouldn’t recommend outright gaming the system. Don’t say you want to pursue Social Entrepreneurship rather than Technology if Tech is really what you are passionate about. It will likely show in your application. However if you are unsure of what you want to focus on, it would make sense to chose the concentration you are interested in that has the highest acceptance rate. There was a lot of variance by school. The chart below shows some of the highest and lowest acceptance rate concentrations by school. Take these findings with a grain of salt because the sample size is pretty small.

School Increase Acceptance Rate Lower Acceptance Rate
Stanford Social Entrepreneurship Finance, Entrepreneurship
Harvard Entrepreneurship Finance*
Wharton Healthcare* Finance, Entrepreneurship, Marketing
Booth Healthcare*, Marketing* Entrepreneurship, Finance, Operations*
Sloan Marketing, Social Entrepreneurship* Technology*, Operations*
Kellogg Entrepreneurship, Marketing, Social Entrepreneurship Operations*, Technology*
Haas Entrepreneurship, Healthcare Operations*, Technology*
Columbia Social Entrepreneurship Entrepreneurship, Marketing, Healthcare
Tuck Healthcare, Marketing Finance, Technology*
Darden Marketing Entrepreneurship, Finance
NYU Entrepreneurship, Finance, Marketing*
Ross Entrepreneurship, Marketing, Healthcare*, Social Entrepreneurship* Finance, Operations*, Technology*
Duke Healthcare, Marketing, Social Entrepreneurship* Finance, Operations*, Technology*
Yale Marketing*, Social Entrepreneurship* Entrepreneurship
Anderson Finance, Marketing Entrepreneurship, Technology
Cornell Finance Entrepreneurship, Operations
McCombs Entrepreneurship, Marketing Finance
Kenan-Flagler Finance, Healthcare*, Marketing*
Tepper Entrepreneurship, Operations, Marketing* Finance
Emory Marketing Finance

*This concentration had a very large increase or decrease.

MBA Waitlist Acceptance Rate Rank

A more up-to-date analysis of MBA waitlist acceptance rate has been completed which include admissions data for the class of 2019.

At this point in the year many applicants have been placed on the waitlist for the school of their dreams. It is a frustrating experience that I personally have experienced. This articles shows the MBA waitlist acceptance rates for the top US MBA programs. The data for this analysis comes from GMATClub. These acceptance rates are meant to give a rough idea of the waitlist acceptance rate and should be taken with a grain of salt. The sample sizes vary by school; Olin, Emory and Stanford have the lowest sample sizes.

MBA Waitlist Acceptance Rate by School Rank

US News Rank School Waitlist Acceptance Rate
1 Stanford 9%
2 Harvard 2%
3 Wharton 6%
4 Booth 15%
5 Sloan 8%
6 Kellogg 6%
7 Haas 4%
8 Columbia 6%
9 Tuck 10%
10 Darden 16%
11 NYU 3%
11 Ross 11%
13 Duke 4%
13 Yale 3%
15 Anderson 18%
16 Cornell 11%
17 McCombs 8%
18 Kenan-Flagler 46%
19 Olin 30%
20 Tepper 13%
21 Emory 4%

MBA waitlist acceptance rates ranges widely from 46% to 2% depending on the school. It tends to vary quite a bit from year to year, so these acceptance rates should only be used as a guide. For example Dartmouth’s average waitlist acceptance rate is 10%, however for the class of 2016 it was only 2%. The top ten schools on average have a slightly lower waitlist acceptance rate coming in at 8% while the next ten schools average a noticeably higher acceptance rate of 14%.

MBA Waitlist Acceptance Rate Rank

Acceptance Rank School Waitlist Acceptance Rate
1 Kenan-Flagler 46%
2 Olin 30%
3 Anderson 18%
4 Darden 16%
5 Booth 15%
6 Tepper 13%
7 Ross 11%
8 Cornell 11%
9 Tuck 10%
10 Stanford 9%
11 Sloan 8%
12 McCombs 8%
13 Kellogg 6%
14 Wharton 6%
15 Columbia 6%
16 Emory 4%
17 Duke 4%
18 Haas 4%
19 Yale 3%
20 NYU 3%
21 Harvard 2%

The schools with the highest MBA waitlist acceptance rates are Kenan-Flagler, Olin, and Anderson. At the other end are Harvard, NYU and Yale with the lowest waitlist acceptance rates. Although NYU has the highest interview acceptance rate, it rarely accepts anyone off the waitlist.

MBA Acceptance Rate by Application Round

An updated MBA acceptance rate by round analysis article can be found here which includes application data from the class 2017 and 2018.

Some business schools have roughly the same acceptance rate during all rounds while others see a significant drop off in later rounds. With applications for round 3 due in the next month or two, this analysis may help you decide which schools to focus on and which to avoid. Here is a list of the top 20 schools’ MBA acceptance rates by application round. The data for this analysis came from GMAT Club, which may be a biased sample. People on GMAT Club tend to have higher GMAT scores than the general applicant pool, so the acceptance rate can be significantly higher for some schools. The acceptance rates are meant to give you an idea of the relationship between rounds, not the absolute acceptance rate. These numbers are raw and not adjusted for other variables such as GMAT and GPA.

MBA Acceptance Rate by Round

The first table is MBA acceptance rates by round ordered by school ranking. The acceptance rates that have a star next to them means that the sample size is very small and might not be very accurate.

US News Rank School Round 1 Round 2 Round 3 Round 4
1 Stanford 8% 5% 2%
1 Wharton 19% 16% 0%*
1 Harvard 12% 6% 4%
4 Booth 29% 25% 15%
5 MIT 16% 11%
6 Kellogg 26% 23% 20%*
7 Haas 17% 17% 6%
8 Columbia 23% 20%
9 Tuck 28% 29% 22% 9%
10 NYU 29% 27% 21%
11 Ross 41% 42% 38%*
11 Darden 32% 33% 16%
13 Yale 24% 27% 9%
14 Duke 31% 33% 21%
15 McCombs 38% 36% 28%
16 Anderson 26% 34% 9%
17 Johnson 39% 36% 37%
18 Tepper 24% 38% 43%
19 Kenan-Flagler 36% 40% 60%
20 Emory 26% 40% 37%

Schools with Significantly Lower Round 3 Acceptance Rate

Many of the top 20 MBA programs have significantly lower acceptance rates in round 3 to the point where it is better to wait until next year to apply. Harvard, Stanford and Wharton, the number one ranked schools, have a large decrease in acceptance rate for round 3. Only 2% to 3% of applications for these schools are in round 3 because everyone knows that acceptance rates are so low. Haas, Yale, Duke, UVA and UCLA also see a significant drops in round 3 admissions compared to earlier rounds. Dartmouth has a respectable round 3 acceptance rate of 22%, but a very low 9% chance of admission for round 4.

Schools with Similar or Higher Round 3 Acceptance Rate

While many schools have a lower acceptance rate for round 3, there are several schools that don’t have a drop off in response. Ross, Cornell, and Emory all have similar admission odds for the third round, while Tepper and UNC actually have a higher acceptance rate for round 3.

Round 3 MBA Acceptance Rate Ranking

This is the the same table as the first one but ranked by round 3 acceptance rate from highest to lowest. Some schools have a round 4 that I did not include, because the sample size was too small. I combined round 4 applications with round 3 except for Tuck because Dartmouth actually had a large number of round 4 applicants.

Round 3 Rank School Round 1 Round 2 Round 3 Round 4
1 Kenan-Flagler 36% 40% 60%
2 Tepper 24% 38% 43%
3 Ross 41% 42% 38%*
4 Johnson 39% 36% 37%
4 Emory 26% 40% 37%
6 McCombs 38% 36% 28%
7 Tuck 28% 29% 22% 9%
8 NYU 29% 27% 21%
8 Duke 31% 33% 21%
10 Kellogg 26% 23% 20%*
11 Darden 32% 33% 16%
12 Booth 29% 25% 15%
13 Yale 24% 27% 9%
13 Anderson 26% 34% 9%
15 Haas 17% 17% 6%
16 Harvard 12% 6% 4%
17 Stanford 8% 5% 2%
18 Wharton 19% 16% 0%*
19 MIT 16% 11%
19 Columbia 23% 20%

The most surprising number is  UNC Kenan-Flagler’s round 3 acceptance rate of 60%, which is significantly higher than that of round 1 and 2. I looked at the GMAT and GPA for each round to see if they would explain the high admissions in round 3, however they were both slightly lower than other rounds. I can’t explain why UNC round 3 acceptance rate is so high, but it is a great school to apply to in the third round.

Kenan-Flagler UNC MBA Acceptance Rate by Round GMAT GPA Admissions Statistics

By request, below is the GMAT, GPA and age for Harvard and Booth by round. Round 3 data does not have a ton of data, so take this with a grain of salt.

School Variable R1 R2 R3
Booth GMAT 735 739 728
Booth GPA 3.61 3.62 3.58
Booth Age 27 28 29
Harvard GMAT 735 728 720
Harvard GPA 3.61 3.57 3.54
Harvard Age 27 27 27

* Sample size is 30 or fewer applications.

MBA Interview Acceptance Rate Rankings

So you have just been invited to interview at the MBA school of your dreams. Obviously this raises your chance of getting in, but by how much? In general, top ten schools have lower MBA interview acceptance rates while schools ranked 11 to 20 have a higher acceptance rate for applicants who were interviewed.

MBA Interview Acceptance Rate by Rank

MBA Interview Acceptance Rate by Rank

Interview acceptance rate for Stanford, Harvard, Wharton, Booth, MIT, Kellogg, Hass, Columbia, Dartmouth, NYU, Ross, Darden, Yale, Duke, McCombs, Anderson, Cornell, Tepper, Kenan-Flagler, Emory

The acceptance rate ranges from 34% to 75% for schools in the top 20. The average MBA interview acceptance rate for the top 10 is 50% and it is 62% for schools ranked 11 to 20.

MBA Interview Acceptance Rate Rankings from Highest to Lowest

MBA Interview Acceptance Rate from Highest to LowestNYU jumps out as the highest acceptance rate by a wide margin. If you have been selected to interview at Stern then you can prepare to open a bottle of champagne because you are probably going to business school. No other school in the top 10 has an interview acceptance rate above 60%.

On the other end of the spectrum is Kellogg and Tuck with the lowest acceptance rates. These two schools will allow anyone who visits campus to interview, so it is not surprising that they admit significantly fewer applicants who are interviewed. Most of the top 10 schools have an acceptance rate clustered between 46% and 51%.

Duke has the lowest acceptance rate for a school not in the top 10 at 52%. The rest of the schools range from 57% to 68%,

Good luck and don’t forget to prepare for your MBA interviews!

Columbia MBA Acceptance Rate Analysis

The Columbia MBA acceptance rate is on the higher side for a top 10 school, at around 18%. Despite the deceptively high acceptance rate, Columbia is still a tough school to gain admission. I built a predictive model which can give you some insight into what the Columbia Business School admissions committee is looking for in applicants.

Columbia MBA Acceptance Rate by GMAT

Columbia MBA Acceptance Rate by GMAT CBS AdmissionsAs expected, Columbia MBA acceptance rate increases as GMAT rises. The average GMAT score is an impressive 719. Increasing GMAT score by 100 points from 650 to 750 increases odds of acceptance by 140%, which is a bigger benefit than MIT.

Columbia MBA Acceptance Rate by GPA

Surprisingly GPA has little to no affect on acceptance rate at Columbia. The average GPA of Columbia applicants is 3.49 while the GPA for those admitted is almost unchanged at 3.51. Stanford is the only other school where GPA doesn’t matter. For those of you out there with a low GPA and high GMAT, Columbia is a great school to apply.

Columbia MBA Acceptance Rate by Round

Columbia MBA Acceptance Rate by Round CBS AdmissionsThe round you apply in impacts Columbia MBA acceptance rate. At CBS, if you apply during Early Decision then you are forced to enroll if accepted. Columbia seems to be worried about yield for accepted students if they are forcing applicants to choose them. If you are serious about Columbia then consider applying Early Decision because you have a slight edge otherwise you might as well wait for regular decision. Columbia is actually rolling admissions, so the sooner you submit your app the faster you get your decision.

Columbia MBA Acceptance Rate by Age

Columbia MBA Acceptance Rate by Age CBS AdmissionsThe age at which you apply has a strong impact on your chance of admission. The best time to apply is when you are 27 or 28. The further a candidate is from the average age, the lower their chance of acceptance is. I believe that this is because candidates with around 5 years of work experience have worked long enough to impress potential employers and contribute to classroom discussion while not being over qualified for on campus recruiting positions. Duke, Cornell and Booth all have a similar age effect.

Other Admissions Factors

Liberal arts majors have roughly twice the acceptance rate as others. I don’t have gender in my data set but my hypothesis is that Columbia is trying to attract women which is why the acceptance rate is so high for liberal arts majors. Acceptance rate is higher for economics majors but lower for finance majors. Consultants also have a major advantage, with an impressive 30% acceptance rate.

Columbia MBA Acceptance Rate by GPA

I updated this article by request to show how Columbia acceptance rate changes by GPA. In the chart below you can see that from 3.0 to 4.0 the acceptance rate stays fairly stable, slightly above 20% for all GPAs other than 3.2 and 3.9. Shockingly the acceptance rate at 3.0 is actually higher than 4.0.Columbia MBA Acceptance Rate by GPA Business School Admissions

CBS Interview Invite Rate and Acceptance Rate by Round

Columbia Business School Interview Rates and Acceptance by Round

A reader asked me how applying early vs. regular affected an applicants chance of being invited to interview and accepted after interview. It looks like applying early does not improve an applicant’s chance of being interviewed but does raise the acceptance rate if invited to interview. Approximately 40% of applicants apply through early decision.

The data for this post comes from GMAT Club.

How Important is the GMAT to Columbia Business School

Every person who has ever considered applying to business school has considered how important the GMAT is to the admissions committee. It could be because that person did well and is hoping that their GMAT score will get them in or it could be that the person is trying to overcome a low GMAT score. I used the admissions data from GMAT Club to come up with actual data to answer this question.

Here is my analysis of how much important to Columbia GMAT is. I looked at everyone who was admitted to CBS and also provided both GMAT and GPA. I found the slope of the admitted students with the lowest score to find out how much the CBS values the GMAT scores.

I used this methodology because it is obvious that most schools will accept someone who has a 4.0 and an 800; it is the people who are on the border who matter. I also removed a few outlier data points on the low side because they probably had very influential connections to get in with their low scores, and that information isn’t relevant to the average applicant.

Columbia GMAT vs. GPA

Columbia GMAT Business School Admissions Application GPA You can see that the slope of the line for accepted students is .0063. This means that for every 10 points higher you score on the GMAT, it is the equivalent of having a GPA that is .063 points higher. So Columbia would roughly consider an applicant with a 800 GMAT and 3.00 GPA as similar to an applicant with a 700 and a 3.63 GPA. The value of .063 is higher than most schools other than Harvard, which is at .093.

Columbia GMAT and GPA. It isn’t helpful to look at the top 50% of applicants because those are not the marginal candidates who barely got in. I occasionally will remove very low outliers because those candidates may have been admitted due to very strong connections that most applicants don’t have. I never remove more than 5% of the total accepted students as outliers. The slope of the scatterplot demonstrates the point at which the school is indifferent to GMAT vs. GPA. The data for this analysis comes from Columbia GMAT Club.